
America's output

How much oil and natural gas the United States produces, the records, and how the shale era reversed a 25-year decline.

US crude oil, this week
13.68M

barrels a day, week ending October 9, 2026. The weekly record: 13.98 million, in the week ending October 2, 2026.

US crude oil, 2025
13.53M

barrels a day on average, about 2.7 times the 2008 low of 4.94 million

US dry natural gas, July 2026
113.7

billion cubic feet a day, a monthly record and up 5.3% from a year earlier

What the numbers measure

Crude oil production is measured in barrels a day. A barrel is 42 gallons, so 13.7 million barrels a day is about 575 million gallons every day.

Natural gas is measured in cubic feet, and Bcf/d means billion cubic feet a day. Dry gas is what remains after liquids such as ethane and propane are separated out: the gas that flows through pipelines to power plants, factories and homes.

The oil figures here cover crude oil only. They leave out natural gas liquids and biofuels, which headlines about total US liquids output often add together with crude.

Crude oil since 1983

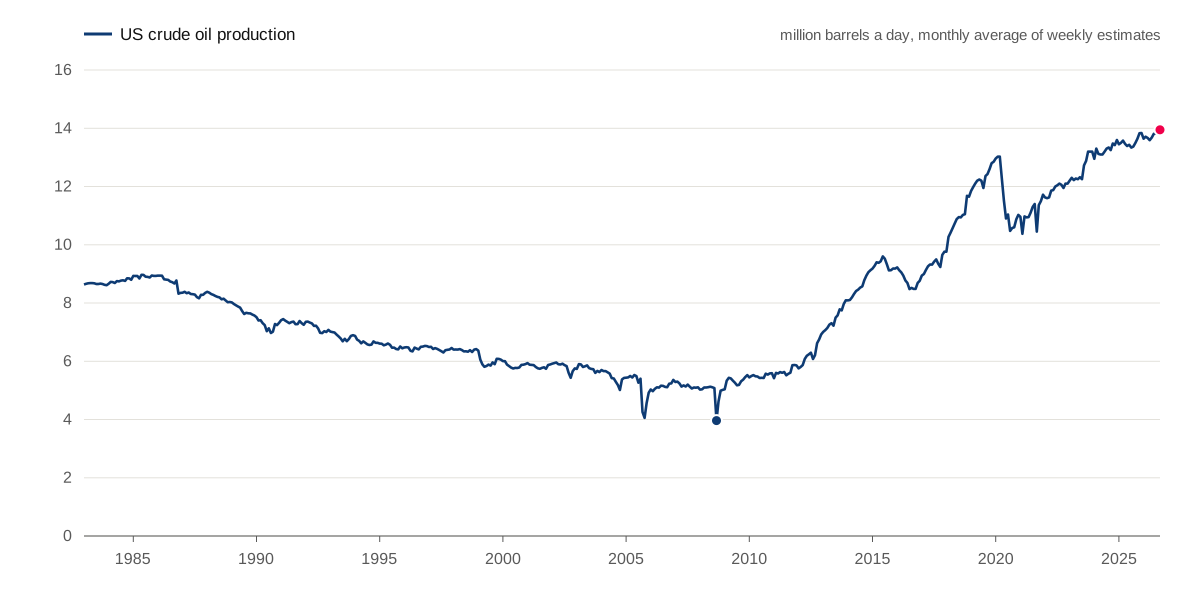
US crude output fell for most of the 23 years after 1985. It averaged 8.92 million barrels a day in 1985 and 4.94 million in 2008, the lowest annual average in this series. Then the shale era began, and output has nearly tripled.

Line chart of US crude oil production from January 1983 to September 2026. It declines to a low of 3.96 million barrels a day in September 2008, then rises to a record 13.95 million in September 2026.
US crude oil production, monthly average of the EIA's weekly estimates, January 1983 to September 2026. The sharp one-month dips are hurricanes and, in February 2021, Winter Storm Uri. Source: U.S. Energy Information Administration.
  • 2008 averaged 4.94 million barrels a day. 2025 averaged 13.53 million, about 2.7 times as much.
  • The monthly record is September 2026, at 13.95 million barrels a day. The weekly record is 13.98 million, in the week ending October 2, 2026.
  • Ten years earlier, in September 2016, output was about 8.49 million barrels a day.
  • The previous all-time high, set in 1970 before this data series begins, was passed in 2018.
  • Over the past year output rose about 3%, from 13.50 million barrels a day in September 2025 to 13.95 million in September 2026.

Natural gas since 1997

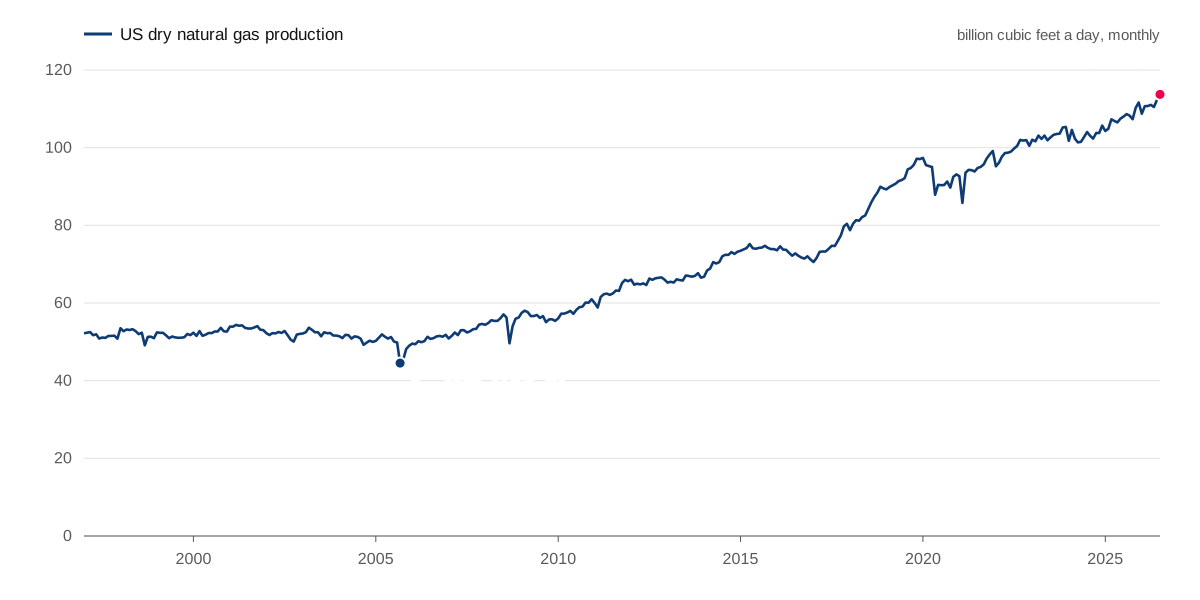
Dry gas production held between about 49 and 54 billion cubic feet a day from 1997 to 2007. Since then it has more than doubled.

Line chart of US dry natural gas production from January 1997 to July 2026. It stays near 52 billion cubic feet a day until 2007, then climbs to a record 113.7 in July 2026.
US dry natural gas production, monthly, January 1997 to July 2026, converted to billion cubic feet a day. Source: U.S. Energy Information Administration.
  • July 2026 set the monthly record at 113.7 billion cubic feet a day, up 5.3% from 108.0 in July 2025.
  • 2025 averaged 107.6 billion cubic feet a day, more than double the 2005 average of 49.5.
  • Ten years earlier, in July 2016, output was about 72.8 billion cubic feet a day.

How shale changed the trend

Two techniques, used together, reversed the decline. Horizontal drilling turns a well sideways so it runs a mile or more through the rock that holds the oil or gas. Hydraulic fracturing opens that tight rock so the oil and gas can flow. Formations that geologists had known about for decades, but that could not produce economically, became the backbone of US supply.

Most US crude now comes from shale and other tight formations, led by the Permian Basin of West Texas and southeastern New Mexico. For natural gas, the Marcellus and Utica shales of the Appalachian Basin and the Haynesville of Louisiana and East Texas are among the largest sources.

Shale wells produce the most in their first months and then decline steeply, so producers have to keep drilling new wells just to hold output steady. Chapter 3 explains how a well's output changes over its life.

Why output sometimes falls

  • Hurricanes: Katrina and Rita in 2005, and Gustav and Ike in 2008, shut in offshore production in the Gulf of Mexico. Those are the sharpest dips on both charts.
  • Price collapses: after oil prices fell in late 2014, crude output slipped from 9.31 million barrels a day in 2015 to 8.77 million in 2016.
  • The pandemic: crude output fell from 12.30 million barrels a day in 2019 to 11.09 million in 2021.
  • Severe cold: in February 2021, Winter Storm Uri froze wells and equipment across Texas, the dip visible on both charts in early 2021.

Output recovered after each of these, but past patterns are not a guide to what production will do next.

Year by year

Annual averages. Natural gas data in this series begins in 1997.

Year
Crude oil (million barrels a day)
Dry natural gas (billion cubic feet a day)
2026 (oil Jan to Sep, gas Jan to Jul)
13.74
111.1
2025
13.53
107.6
2024
13.26
103.1
2023
12.58
103.1
2022
11.91
99.3
2021
11.09
94.5
2020
11.52
92.4
2019
12.30
92.9
2018
10.83
84.3
2017
9.32
74.9
2016
8.77
72.7
2015
9.31
74.2
2014
8.55
70.9
2013
7.47
66.3
2012
6.23
65.7
2011
5.65
62.7
2010
5.50
58.4
2009
5.32
56.5
2008
4.94
55.1
2007
5.16
52.8
2006
5.14
50.7
2005
5.11
49.5
2004
5.45
50.8
2003
5.76
52.3
2002
5.81
51.9
2001
5.83
53.7
2000
5.85
52.4
1999
5.98
51.6
1998
6.38
52.1
1997
6.41
51.6
1996
6.46
n/a
1995
6.52
n/a
1994
6.66
n/a
1993
6.85
n/a
1992
7.16
n/a
1991
7.34
n/a
1990
7.24
n/a
1989
7.76
n/a
1988
8.20
n/a
1987
8.30
n/a
1986
8.73
n/a
1985
8.92
n/a
1984
8.76
n/a
1983
8.66
n/a

How it is calculated

Crude oil: the U.S. Energy Information Administration's weekly estimate of US field production of crude oil (series WCRFPUS2). Natural gas: the EIA's monthly US dry natural gas production (series N9070US2), reported in million cubic feet per month.

Monthly oil figures are the average of the weekly estimates in that month; October 2026 is left out of the chart and table until the month is complete. Gas is converted to billion cubic feet a day by dividing each month's total by the number of days in the month. Annual figures are the average of the monthly figures.

The EIA's weekly oil production numbers are estimates, rounded and modeled from the latest available data. The EIA later publishes survey-based monthly figures in its Petroleum Supply Monthly, which can differ slightly. We use the weekly series because it is the most current, and we use the latest published values.

Monthly gas figures are published about two months after the month they describe and can be revised.

Collected and calculated by Bedrock, Basin Ventures' data system. Last updated October 20, 2026.

faq

Questions about production

Is the US the world's largest oil producer?

Yes. According to the EIA, the United States has produced more crude oil than any other country every year since 2018, ahead of Saudi Arabia and Russia. It is also the world's largest natural gas producer.

Why does the weekly number differ from the monthly one?

The weekly figure is an early estimate the EIA publishes for speed. About two months later it publishes a monthly figure based on surveys of operators and state data, which is more precise. The two are usually close, and this chapter uses the weekly series because it is the most current.

What is the difference between crude oil and natural gas liquids?

Crude oil comes out of the ground as a liquid. Natural gas liquids, such as ethane, propane and butane, come out with the gas and are separated from it at processing plants. They are counted separately from crude oil, and they are not included in the oil figures on this page.

Why does US output keep growing when individual wells decline?

Because operators keep drilling. Each new well produces the most in its first months, so as long as enough new wells come online, their early output more than replaces the decline of older wells. When drilling slows, national output tends to flatten or fall.

Does this chapter forecast production?

No. It shows what production has been and explains what has moved it. It is not a forecast of future output or prices, and not a recommendation to buy or sell anything.

Back to the guide: Oil & Gas, Explained
Click to Join
Kontix-home-one-marquee-icon-webflow-ecommerce-template
Fund V Has Launched
Secure Your Allocation
Kontix-home-one-marquee-icon-webflow-ecommerce-template
For Accredited Investors
Click to Join
Kontix-home-one-marquee-icon-webflow-ecommerce-template
Fund V Has Launched
Secure Your Allocation
Kontix-home-one-marquee-icon-webflow-ecommerce-template
For Accredited Investors
Click to Join
Kontix-home-one-marquee-icon-webflow-ecommerce-template
Fund V Has Launched
Secure Your Allocation
Kontix-home-one-marquee-icon-webflow-ecommerce-template
For Accredited Investors
Let’s connect

Start earning monthly income now.

Deduct up to 100% of your investment the first year.