
What oil and gas are worth

The prices everyone quotes, what they actually measure, and how today's prices compare with 40 years of history once inflation is taken into account.

WTI crude, this week
$96.88

per barrel, week ending October 9, 2026

Week ending Oct 9, 2026
WTI average since 1986
$76

per barrel, in today's dollars

Jan 1986 to Sep 2026
Henry Hub gas, September 2026
$2.92

per million Btu, lower than about nine in ten months since 1997 in today's dollars

Sep 2026

The prices everyone quotes

When the news says oil is $97, it almost always means West Texas Intermediate, or WTI: a light, low-sulfur crude oil delivered at Cushing, Oklahoma, the main US trading hub. Outside the US, the usual reference is Brent, a crude from the North Sea. Both are quoted in US dollars per barrel, and a barrel is 42 gallons.

US natural gas is quoted at Henry Hub, a pipeline junction in Erath, Louisiana, where many interstate pipelines meet. Its price is in dollars per million British thermal units (MMBtu), a measure of the energy in the gas rather than its volume. A thousand cubic feet of gas holds roughly one million Btu.

The figures in this chapter are spot prices: what physical oil or gas sold for on the day, averaged over the week or the month. Futures prices, quoted for delivery months ahead, can differ from the spot price.

Forty years of oil, in today's dollars

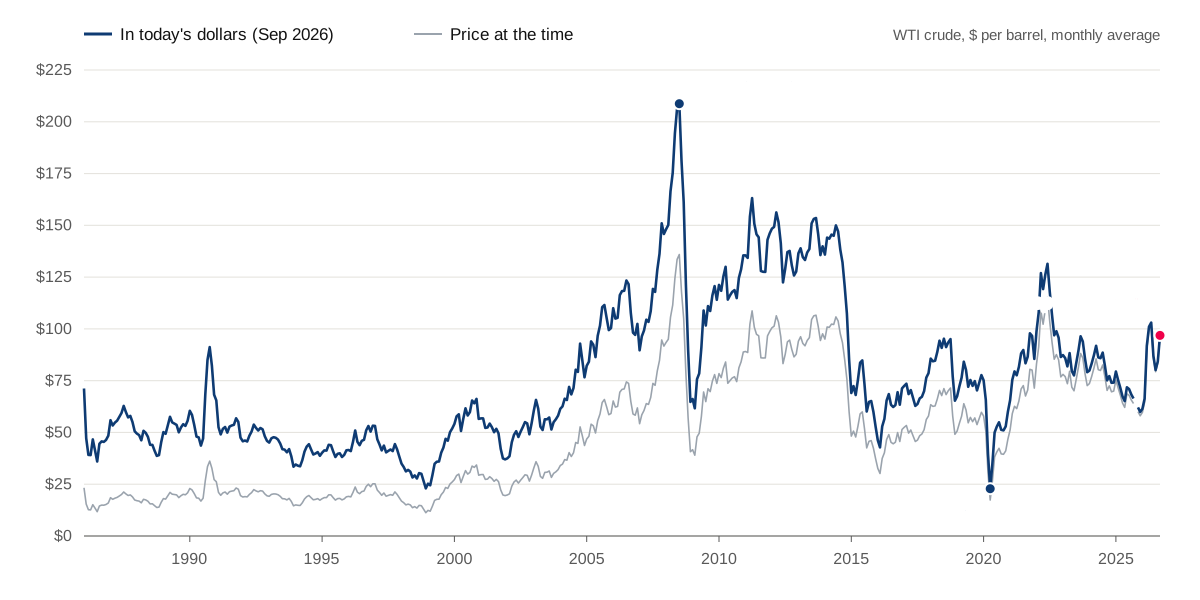
A barrel of WTI averaged $14.98 in 1986. In 1986 money that sounds cheap. In today's money it was about $46. Adjusting for inflation is the only fair way to compare prices across decades, and it changes the story.

Line chart of the WTI crude oil price from January 1986 to September 2026, in September 2026 dollars and at the time. It peaks at $208.74 in July 2008, falls to $22.84 in April 2020, and was $96.84 in September 2026.
WTI crude oil spot price, monthly average, January 1986 to September 2026. Blue: in September 2026 dollars. Gray: the price at the time. The break in the line is October 2025, which has no inflation figure. Sources: U.S. Energy Information Administration, FRED.
  • Since January 1986, WTI has averaged about $76 a barrel in today's dollars.
  • The highest monthly average was July 2008: $135.94 at the time, about $209 today.
  • The lowest was April 2020, when demand collapsed early in the pandemic: $17.38 at the time, about $23 today.
  • By decade, in today's dollars: about $86 in the 2000s, $104 in the 2010s, and $79 over the last ten years.
  • September 2026 averaged $96.84, higher than about three in four months since 1986 once inflation is taken into account.

Natural gas since 1997

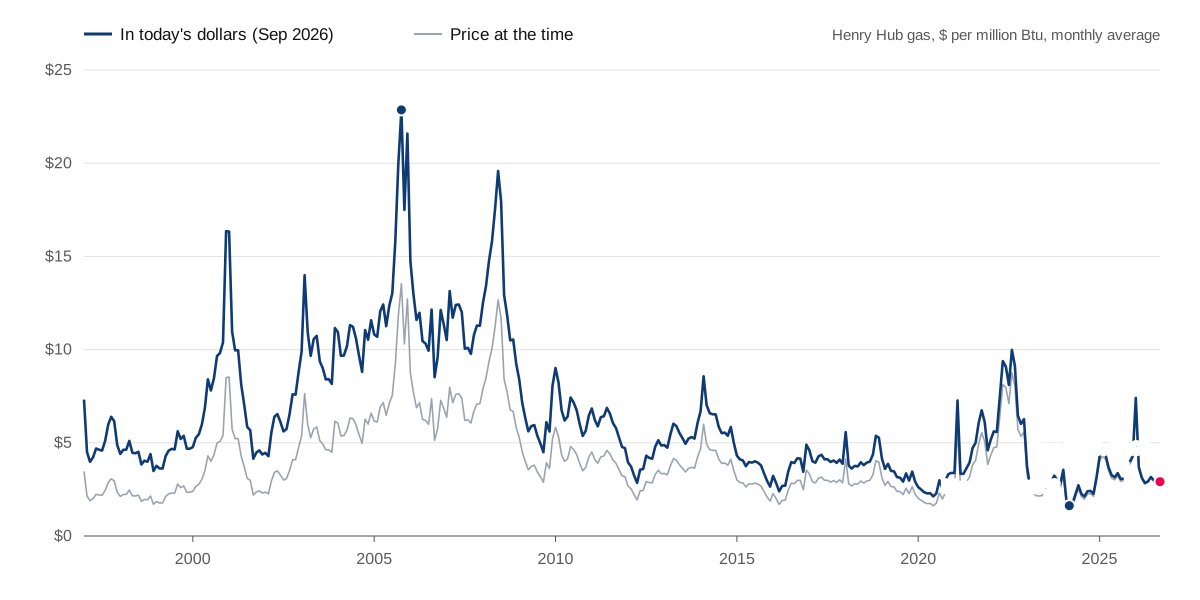
Henry Hub gas has been far more volatile than oil. In today's dollars it has averaged about $6.33 per million Btu since 1997. It peaked at $22.86 in October 2005, after Hurricanes Katrina and Rita shut in Gulf of Mexico production, and reached its low of $1.63 in March 2024.

Line chart of the Henry Hub natural gas price from January 1997 to September 2026, in September 2026 dollars and at the time. It peaks at $22.86 in October 2005, falls to $1.63 in March 2024, and was $2.92 in September 2026.
Henry Hub natural gas spot price, monthly average, January 1997 to September 2026. Blue: in September 2026 dollars. Gray: the price at the time. The break in the line is October 2025, which has no inflation figure. Sources: U.S. Energy Information Administration, FRED.

September 2026 averaged $2.92, lower than about nine in ten months since 1997 in today's dollars. US gas production grew so quickly after the shale boom began in the late 2000s that prices, adjusted for inflation, have spent most of the years since well below their 2000s levels.

What moves the price

  • Supply: how much the world's producers pump, including decisions by OPEC and its partners, and how quickly US operators add or idle drilling rigs.
  • Demand: economic growth, travel and industry. Diesel and jet fuel track freight and flying.
  • Storage: oil in tanks and caverns, including the Strategic Petroleum Reserve, cushions surprises. When storage is low, small disruptions move prices more.
  • Disruptions: wars, sanctions, hurricanes and pipeline outages.
  • The dollar: oil is priced in dollars, so a stronger dollar makes it more expensive for buyers paying in other currencies.
  • For natural gas, weather matters most. Heating and power demand swing with the seasons, storage fills in summer and empties in winter, and export terminals for liquefied natural gas (LNG) now link US gas more closely to prices overseas.

None of these lets anyone call the next move reliably, and this guide does not try.

The price a producer actually receives

A producer rarely receives the headline price. Oil sold in West Texas or North Dakota is priced off WTI, plus or minus a differential for its quality and the cost of moving it to market. Gas is sold at local hubs that can trade well below Henry Hub when pipelines are full.

Taxes, gathering and transport fees, and payments to the mineral owner also come out before a working-interest owner's share is paid. That is why this guide shows the benchmark: it is the common reference anyone can check, not the price on any particular check.

Year by year

Annual averages of the monthly prices, at the time and in September 2026 dollars. Henry Hub data in this series begins in 1997.

Year
WTI at the time ($/bbl)
WTI in today's dollars
Henry Hub at the time ($/MMBtu)
Henry Hub in today's dollars
2026 (Jan to Sep)
$84.72
$85.76
$3.48
$3.54
2025 (11 months)
$65.95
$68.92
$3.57
$3.72
2024
$76.57
$82.11
$2.21
$2.37
2023
$77.67
$85.71
$2.55
$2.81
2022
$95.14
$109.42
$6.41
$7.35
2021
$67.78
$83.97
$3.91
$4.85
2020
$39.25
$50.93
$2.03
$2.64
2019
$56.84
$74.76
$2.56
$3.37
2018
$65.08
$87.17
$3.18
$4.26
2017
$50.85
$69.75
$2.99
$4.11
2016
$43.17
$60.44
$2.49
$3.49
2015
$48.70
$69.11
$2.63
$3.73
2014
$93.53
$132.88
$4.40
$6.26
2013
$98.00
$141.46
$3.73
$5.38
2012
$94.25
$138.09
$2.75
$4.03
2011
$94.74
$141.66
$4.00
$5.98
2010
$79.21
$122.14
$4.40
$6.78
2009
$61.46
$96.17
$3.93
$6.16
2008
$99.87
$155.71
$8.90
$13.89
2007
$72.08
$116.69
$6.96
$11.29
2006
$66.12
$110.30
$6.78
$11.31
2005
$56.41
$97.05
$8.75
$15.03
2004
$41.31
$73.47
$5.86
$10.44
2003
$31.12
$56.87
$5.48
$10.02
2002
$26.06
$48.69
$3.36
$6.27
2001
$26.01
$49.42
$4.01
$7.63
2000
$30.29
$59.14
$4.25
$8.27
1999
$19.18
$38.64
$2.26
$4.56
1998
$14.44
$29.80
$2.10
$4.33
1997
$20.59
$43.15
$2.49
$5.21
1996
$22.11
$47.38
n/a
n/a
1995
$18.42
$40.66
n/a
n/a
1994
$17.16
$38.93
n/a
n/a
1993
$18.48
$43.04
n/a
n/a
1992
$20.55
$49.25
n/a
n/a
1991
$21.61
$53.39
n/a
n/a
1990
$24.49
$62.83
n/a
n/a
1989
$19.61
$53.20
n/a
n/a
1988
$15.96
$45.42
n/a
n/a
1987
$19.15
$56.67
n/a
n/a
1986
$14.98
$45.91
n/a
n/a

How it is calculated

Oil: the U.S. Energy Information Administration's weekly WTI spot price at Cushing, Oklahoma (series RWTC). Natural gas: the EIA's weekly Henry Hub spot price (series RNGWHHD). Inflation: the Consumer Price Index for All Urban Consumers, seasonally adjusted (FRED series CPIAUCSL).

Each month's price is the average of the weekly prices in that month. To put a month in today's dollars, we multiply it by the latest CPI (September 2026) divided by that month's CPI. Annual figures are the average of the monthly figures.

October 2025 is left out because no CPI value exists for that month in the FRED series. As a result, the 2025 averages use the other eleven months. 2026 covers January to September.

The EIA's weekly spot prices are averages of daily prices, and the EIA sometimes revises past values. We use the latest published figures.

The CPI measures consumer prices in general, not oilfield costs. "Today's dollars" tells you what the money was worth, not what it would cost to drill a well today.

Collected and calculated by Bedrock, Basin Ventures' data system. Last updated October 20, 2026.

faq

Questions about prices

Why does the US quote WTI instead of Brent?

WTI is priced at Cushing, Oklahoma, where much of the oil produced in the middle of the country is stored and traded, so it is the natural reference for US crude. Brent, from the North Sea, is the main reference for oil traded internationally. The two usually move together, a few dollars apart.

What is a spot price?

The price for oil or gas delivered now, rather than in a future month. The EIA publishes daily spot prices and weekly averages of them, and the weekly averages are what this chapter uses.

Why was oil so cheap in April 2020?

Early in the pandemic, travel and industry stopped almost overnight and storage tanks filled up. On April 20, 2020, WTI briefly traded below zero. The spot price averaged $17.38 for the month, about $23 in today's dollars.

Does this page predict prices?

No. It shows what prices have been and explains what tends to move them. It is not a forecast and not a recommendation to buy or sell anything.

How often is this chapter updated?

Prices are refreshed weekly after the EIA's release. The inflation adjustment moves forward each month, when a new Consumer Price Index figure is published.

Click to Join
Kontix-home-one-marquee-icon-webflow-ecommerce-template
Fund V Has Launched
Secure Your Allocation
Kontix-home-one-marquee-icon-webflow-ecommerce-template
For Accredited Investors
Click to Join
Kontix-home-one-marquee-icon-webflow-ecommerce-template
Fund V Has Launched
Secure Your Allocation
Kontix-home-one-marquee-icon-webflow-ecommerce-template
For Accredited Investors
Click to Join
Kontix-home-one-marquee-icon-webflow-ecommerce-template
Fund V Has Launched
Secure Your Allocation
Kontix-home-one-marquee-icon-webflow-ecommerce-template
For Accredited Investors
Let’s connect

Start earning monthly income now.

Deduct up to 100% of your investment the first year.