Watch Replay: Basin Ventures Q3 Investor Webinar
Watch Now



The short version
On October 9, the Treasury Department licensed Russian diesel to be bought, shipped and brought into the United States through next April.1 The President said the first tranche would be more than 300,000 tons, roughly 2.25 million barrels.2 On Wednesday, Russia's deputy prime minister said the first tanker, about 40,000 tons or roughly 300,000 barrels, sails Thursday, with more to follow.3
Americans burn about 4 million barrels a day of diesel and heating oil, which the industry lumps together as "distillate," so that tranche covers about 13 hours. The first tanker covers less than two. Over the last four weeks, the U.S. exported an average of 1.5 million barrels of diesel a day,4 mostly from Gulf Coast refineries.5 We're shipping diesel out of Texas and Louisiana and lining up Russian diesel at the same time. That's the whole story in one map.

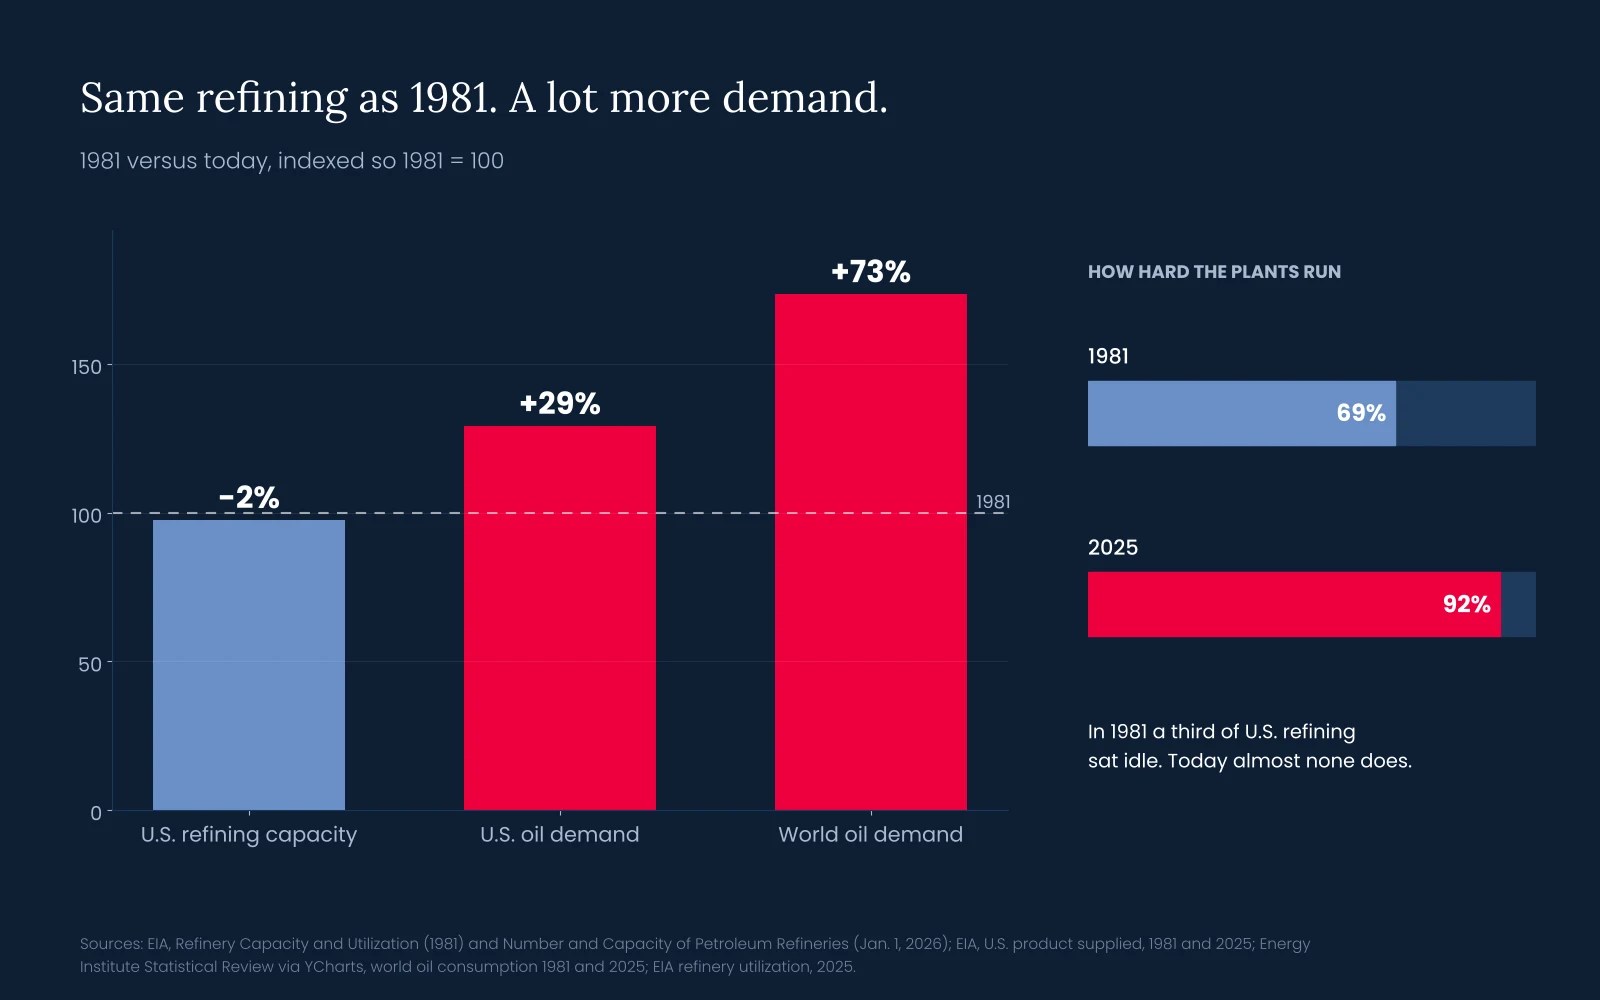
In 1981, the United States had 324 refineries and 18.6 million barrels a day of refining capacity.6 Today it has 130 refineries and 18.2 million barrels a day.7 Over the same stretch, American demand for oil grew 29%,8 and the world's grew 73%.9
We kept up by running the same plants harder. In 1981, a third of U.S. refining capacity sat idle. Last year the plants ran at 92%.6,10 That idle third was the country's cushion against a shock, and it's gone.
My friends who run refineries will wince at everything I leave out here. They already know this part.
Think about a barrel of crude the way a rancher thinks about a steer. It goes to a packing plant and comes out as ribeyes, brisket, ground beef and a long list of things you'll never see on a menu. Nobody can raise a steer that's all ribeye. And if every packing plant in the region is running full, more cattle in the pasture doesn't put one more steak in the grocery store. (Fitting analogy, given my last name.)
A refinery heats crude until it boils inside a tall column called a distillation tower, and the oil separates by weight. Propane and gasoline rise to the top. Jet fuel and diesel come off the middle. The heavy stuff that becomes fuel oil and asphalt stays at the bottom. Units called cokers and crackers then work like a meat grinder, breaking those heavy leftovers into more valuable fuel. U.S. refineries turn about 30% of every barrel into diesel and heating oil and about 46% into gasoline.11 Refiners can nudge that a few points. No refinery turns a barrel of crude into a barrel of diesel.12

Right now the plants are close to full. U.S. refineries ran at 93.4% of capacity in the week ending October 16 and made 5.23 million barrels a day of diesel and heating oil, well above last year's average of 4.90 million.4 Drilling more wells puts more cattle in the pasture. It doesn't build another packing plant.
Crude comes in grades. Light oil is thin and pours almost like water. Heavy oil is closer to molasses and takes more equipment to turn into fuel. The industry measures weight on a scale called API gravity, where a higher number means lighter oil, and calls low-sulfur crude "sweet" and high-sulfur crude "sour."
The shale boom gave America an ocean of light, sweet oil. Production hit a record of nearly 14 million barrels a day last October,13 and 57% of Lower 48 output scores above 40 on that scale.14 The big Gulf Coast refineries, which hold 54% of the country's capacity,15 were built with cokers to run cheaper heavy, sour crude.16 The average barrel U.S. refineries ran last year scored 33.8.17 So the oil trades. America sells light oil to refineries overseas built to run it and buys heavier oil, mostly from Canada. About 62% of what American refineries run is still American oil.18

Ranchers will recognize this. American grain-fed beef runs fatty, so U.S. meatpackers import lean trimmings and blend them in to make hamburger, while our grain-fed beef brings top dollar overseas.19 Nobody calls that a beef shortage. Crude works the same way.
In 1982 the East Coast had 27 refineries. Today it has 8, with about half the capacity.15 The biggest single loss was Philadelphia Energy Solutions, a 335,000-barrel-a-day plant that shut after an explosion and fire in 2019.20 The region still eats plenty of beef. It just closed most of its packing plants.
So it hauls fuel in from Texas. The Colonial Pipeline moves about 2.5 million barrels a day from Houston to New York Harbor,21 and its main lines have long run near capacity. The backup is a ship, and that's where the Jones Act comes in. Since 1920 it has required cargo moving between two U.S. ports to ride on American-built, American-owned, American-crewed ships. Picture a rule that cattle hauled from Amarillo to Atlanta can only ride in American-built trailers, and the whole country has 43 of them. That's the number of product tankers in the Jones Act fleet, and at points last year their rates ran about ten times international rates.22
That's why the map at the top looks backward. Gulf Coast refiners sell diesel to Mexico, Chile, Brazil and Europe on cheap foreign tankers,5 while the Northeast imports, mostly from Canada.23 About 4.8 million American households heat with oil, and 82% of them are in the Northeast.24 When diesel gets tight, they feel it in the furnace first.
The Tanker War of the 1980s never shut Hormuz; at its worst, attacks hit about 2% of the ships passing through the Gulf.25 In 1990, when Iraq invaded Kuwait, Saudi Arabia raised output by about 3 million barrels a day within four months to cover the loss.26 This time, the strait that normally carries about a fifth of the world's oil is the thing under attack,27 running well below normal for months, and much of the world's spare production capacity sits behind it.
The Persian Gulf is also one of the world's biggest diesel exporters. In September the Middle East shipped 1.9 million barrels a day of refined products, against 4.7 million before the war, and Middle East and Russian diesel exports together fell 1.3 million barrels a day from a year earlier.28 Russia banned most diesel exports in July as Ukrainian drones hit its refineries, and only partly lifted the ban on October 10.29 Stratas Advisors puts the world's third-quarter gasoil (diesel) output 1.7 million barrels a day below a year earlier, even as crude shipments recover.30
Everybody is bidding for the same barrels. U.S. diesel stocks are at 104.3 million barrels, the lowest for this time of year since EIA's weekly records began in 1982. They ticked up last week only because Americans bought less diesel at $6 a gallon. East Coast stocks fell again, to 21.0 million barrels, the lowest for this time of year since that series began in 1990 and 4.5 million barrels below the same week of 2022, the previous low.4 Diesel at the pump averaged $6.32 a gallon on October 21, against $3.62 a year ago,31 and East Coast homeowners paid $6.15 a gallon for heating oil last week, $2.60 more than a year earlier.32

None of this happened overnight. New York and New Jersey regulators turned down two pipelines meant to carry Pennsylvania gas into the Northeast, where one home in three in New England still heats with oil.24 Their developer gave up on one in 2020 and the other in 2024, before Washington pushed both back onto the table last year.33 The Keystone XL permit was revoked in the new administration's first week in January 2021, and new federal oil and gas leasing was paused days later.34 California set out to phase out fossil fuels while two of its refineries, about 17% of the state's capacity, moved to close.35
Capital reads those signals. A refinery or a pipeline pays back over decades, and nobody commits that kind of money where the people writing the rules have promised to shut them down. Good policy is whatever lets Americans build, whoever writes it.
By that same test, the latest fixes come up short. Critics say the Russian license runs against a 2022 law that passed the Senate 100 to 0.36 Before that ban, the U.S. bought about 673,000 barrels a day from Russia, and only about 24,000 of it was diesel.37 The President wants about 13.5 million barrels delivered over the first three months. Rapidan Energy Group estimates Russia can only guarantee about 6 million of that, and that the deal adds perhaps 100,000 to 200,000 barrels a day against roughly 1 million the world lost.38,39
Any diesel Russia sends us is diesel it isn't sending someone else, and the same goes for emergency reserve releases, like the 315,000 barrels the Energy Department offered Wednesday to lend out of the Northeast heating oil reserve, about a third of what's in it.40 They buy a few weeks of calmer headlines, and the bill comes due on the same tight market. We're running our entire energy policy on a credit card right now. What actually helps is boring: keep Gulf Coast refineries running full, make it cheaper to move American fuel between American ports, and let the price signal do its job. It's starting to: Baker Hughes counted 603 rigs last week, 55 more than a year ago.41
Diesel moves everything you buy. It runs the trucks that stock the grocery store, the tractors bringing in the harvest and, in the Northeast, the furnace. When it climbs 74% in a year, it shows up on every receipt. Being the biggest producer on earth doesn't make Americans immune to a world price. It makes us the country best positioned to answer one, and the families who feel an energy crunch least are the ones who own a piece of the production. I wrote about that in Oil Isn't Inflationary If You Own It.
That's what Basin Ventures does. We invest alongside established, mostly publicly traded operators in American oil and natural gas wells, and we've been heavily invested in Oklahoma's Cherokee play for the past two years. We underwrite every project on conservative long-term price assumptions well below the futures market, so our deals don't depend on a market like this one.
Basin Ventures Fund V is open to accredited investors now. It already holds interests in wells in Oklahoma's Anadarko Basin, an oil, gas and NGL play, and in Louisiana's Haynesville, which is all natural gas, and we're reviewing new projects across the country to round it out. To learn more, visit basinventures.com.
I write about supply, demand and energy policy every week. Follow along at @TheTXOilMan on X, Instagram, Facebook and LinkedIn.
This article is for informational purposes only and is not an offer to sell or a solicitation of an offer to buy any security. Investments in oil and gas involve substantial risk, including the possible loss of principal, and are suitable only for accredited investors. Past performance does not guarantee future results.



The short version
On October 9, the Treasury Department licensed Russian diesel to be bought, shipped and brought into the United States through next April.1 The President said the first tranche would be more than 300,000 tons, roughly 2.25 million barrels.2 On Wednesday, Russia's deputy prime minister said the first tanker, about 40,000 tons or roughly 300,000 barrels, sails Thursday, with more to follow.3
Americans burn about 4 million barrels a day of diesel and heating oil, which the industry lumps together as "distillate," so that tranche covers about 13 hours. The first tanker covers less than two. Over the last four weeks, the U.S. exported an average of 1.5 million barrels of diesel a day,4 mostly from Gulf Coast refineries.5 We're shipping diesel out of Texas and Louisiana and lining up Russian diesel at the same time. That's the whole story in one map.
In 1981, the United States had 324 refineries and 18.6 million barrels a day of refining capacity.6 Today it has 130 refineries and 18.2 million barrels a day.7 Over the same stretch, American demand for oil grew 29%,8 and the world's grew 73%.9
We kept up by running the same plants harder. In 1981, a third of U.S. refining capacity sat idle. Last year the plants ran at 92%.6,10 That idle third was the country's cushion against a shock, and it's gone.
My friends who run refineries will wince at everything I leave out here. They already know this part.
Think about a barrel of crude the way a rancher thinks about a steer. It goes to a packing plant and comes out as ribeyes, brisket, ground beef and a long list of things you'll never see on a menu. Nobody can raise a steer that's all ribeye. And if every packing plant in the region is running full, more cattle in the pasture doesn't put one more steak in the grocery store. (Fitting analogy, given my last name.)
A refinery heats crude until it boils inside a tall column called a distillation tower, and the oil separates by weight. Propane and gasoline rise to the top. Jet fuel and diesel come off the middle. The heavy stuff that becomes fuel oil and asphalt stays at the bottom. Units called cokers and crackers then work like a meat grinder, breaking those heavy leftovers into more valuable fuel. U.S. refineries turn about 30% of every barrel into diesel and heating oil and about 46% into gasoline.11 Refiners can nudge that a few points. No refinery turns a barrel of crude into a barrel of diesel.12
Right now the plants are close to full. U.S. refineries ran at 93.4% of capacity in the week ending October 16 and made 5.23 million barrels a day of diesel and heating oil, well above last year's average of 4.90 million.4 Drilling more wells puts more cattle in the pasture. It doesn't build another packing plant.
Crude comes in grades. Light oil is thin and pours almost like water. Heavy oil is closer to molasses and takes more equipment to turn into fuel. The industry measures weight on a scale called API gravity, where a higher number means lighter oil, and calls low-sulfur crude "sweet" and high-sulfur crude "sour."
The shale boom gave America an ocean of light, sweet oil. Production hit a record of nearly 14 million barrels a day last October,13 and 57% of Lower 48 output scores above 40 on that scale.14 The big Gulf Coast refineries, which hold 54% of the country's capacity,15 were built with cokers to run cheaper heavy, sour crude.16 The average barrel U.S. refineries ran last year scored 33.8.17 So the oil trades. America sells light oil to refineries overseas built to run it and buys heavier oil, mostly from Canada. About 62% of what American refineries run is still American oil.18
Ranchers will recognize this. American grain-fed beef runs fatty, so U.S. meatpackers import lean trimmings and blend them in to make hamburger, while our grain-fed beef brings top dollar overseas.19 Nobody calls that a beef shortage. Crude works the same way.
In 1982 the East Coast had 27 refineries. Today it has 8, with about half the capacity.15 The biggest single loss was Philadelphia Energy Solutions, a 335,000-barrel-a-day plant that shut after an explosion and fire in 2019.20 The region still eats plenty of beef. It just closed most of its packing plants.
So it hauls fuel in from Texas. The Colonial Pipeline moves about 2.5 million barrels a day from Houston to New York Harbor,21 and its main lines have long run near capacity. The backup is a ship, and that's where the Jones Act comes in. Since 1920 it has required cargo moving between two U.S. ports to ride on American-built, American-owned, American-crewed ships. Picture a rule that cattle hauled from Amarillo to Atlanta can only ride in American-built trailers, and the whole country has 43 of them. That's the number of product tankers in the Jones Act fleet, and at points last year their rates ran about ten times international rates.22
That's why the map at the top looks backward. Gulf Coast refiners sell diesel to Mexico, Chile, Brazil and Europe on cheap foreign tankers,5 while the Northeast imports, mostly from Canada.23 About 4.8 million American households heat with oil, and 82% of them are in the Northeast.24 When diesel gets tight, they feel it in the furnace first.
The Tanker War of the 1980s never shut Hormuz; at its worst, attacks hit about 2% of the ships passing through the Gulf.25 In 1990, when Iraq invaded Kuwait, Saudi Arabia raised output by about 3 million barrels a day within four months to cover the loss.26 This time, the strait that normally carries about a fifth of the world's oil is the thing under attack,27 running well below normal for months, and much of the world's spare production capacity sits behind it.
The Persian Gulf is also one of the world's biggest diesel exporters. In September the Middle East shipped 1.9 million barrels a day of refined products, against 4.7 million before the war, and Middle East and Russian diesel exports together fell 1.3 million barrels a day from a year earlier.28 Russia banned most diesel exports in July as Ukrainian drones hit its refineries, and only partly lifted the ban on October 10.29 Stratas Advisors puts the world's third-quarter gasoil (diesel) output 1.7 million barrels a day below a year earlier, even as crude shipments recover.30
Everybody is bidding for the same barrels. U.S. diesel stocks are at 104.3 million barrels, the lowest for this time of year since EIA's weekly records began in 1982. They ticked up last week only because Americans bought less diesel at $6 a gallon. East Coast stocks fell again, to 21.0 million barrels, the lowest for this time of year since that series began in 1990 and 4.5 million barrels below the same week of 2022, the previous low.4 Diesel at the pump averaged $6.32 a gallon on October 21, against $3.62 a year ago,31 and East Coast homeowners paid $6.15 a gallon for heating oil last week, $2.60 more than a year earlier.32
None of this happened overnight. New York and New Jersey regulators turned down two pipelines meant to carry Pennsylvania gas into the Northeast, where one home in three in New England still heats with oil.24 Their developer gave up on one in 2020 and the other in 2024, before Washington pushed both back onto the table last year.33 The Keystone XL permit was revoked in the new administration's first week in January 2021, and new federal oil and gas leasing was paused days later.34 California set out to phase out fossil fuels while two of its refineries, about 17% of the state's capacity, moved to close.35
Capital reads those signals. A refinery or a pipeline pays back over decades, and nobody commits that kind of money where the people writing the rules have promised to shut them down. Good policy is whatever lets Americans build, whoever writes it.
By that same test, the latest fixes come up short. Critics say the Russian license runs against a 2022 law that passed the Senate 100 to 0.36 Before that ban, the U.S. bought about 673,000 barrels a day from Russia, and only about 24,000 of it was diesel.37 The President wants about 13.5 million barrels delivered over the first three months. Rapidan Energy Group estimates Russia can only guarantee about 6 million of that, and that the deal adds perhaps 100,000 to 200,000 barrels a day against roughly 1 million the world lost.38,39
Any diesel Russia sends us is diesel it isn't sending someone else, and the same goes for emergency reserve releases, like the 315,000 barrels the Energy Department offered Wednesday to lend out of the Northeast heating oil reserve, about a third of what's in it.40 They buy a few weeks of calmer headlines, and the bill comes due on the same tight market. We're running our entire energy policy on a credit card right now. What actually helps is boring: keep Gulf Coast refineries running full, make it cheaper to move American fuel between American ports, and let the price signal do its job. It's starting to: Baker Hughes counted 603 rigs last week, 55 more than a year ago.41
Diesel moves everything you buy. It runs the trucks that stock the grocery store, the tractors bringing in the harvest and, in the Northeast, the furnace. When it climbs 74% in a year, it shows up on every receipt. Being the biggest producer on earth doesn't make Americans immune to a world price. It makes us the country best positioned to answer one, and the families who feel an energy crunch least are the ones who own a piece of the production. I wrote about that in Oil Isn't Inflationary If You Own It.
That's what Basin Ventures does. We invest alongside established, mostly publicly traded operators in American oil and natural gas wells, and we've been heavily invested in Oklahoma's Cherokee play for the past two years. We underwrite every project on conservative long-term price assumptions well below the futures market, so our deals don't depend on a market like this one.
Basin Ventures Fund V is open to accredited investors now. It already holds interests in wells in Oklahoma's Anadarko Basin, an oil, gas and NGL play, and in Louisiana's Haynesville, which is all natural gas, and we're reviewing new projects across the country to round it out. To learn more, visit basinventures.com.
I write about supply, demand and energy policy every week. Follow along at @TheTXOilMan on X, Instagram, Facebook and LinkedIn.
This article is for informational purposes only and is not an offer to sell or a solicitation of an offer to buy any security. Investments in oil and gas involve substantial risk, including the possible loss of principal, and are suitable only for accredited investors. Past performance does not guarantee future results.

© Copyright 2026 Basin Ventures II, LLC. All rights reserved.