Watch Replay: Basin Ventures Q1 Investor Webinar
Watch Now
Website Cookies
This website uses cookies to ensure you get the best experience on our site.

We have written often about the tailwinds building behind U.S. natural gas: rising LNG export capacity, AI-driven power demand, and a storage-to-demand balance that has been tightening for over a decade. The events of March and April 2026 have accelerated every one of those trends simultaneously.
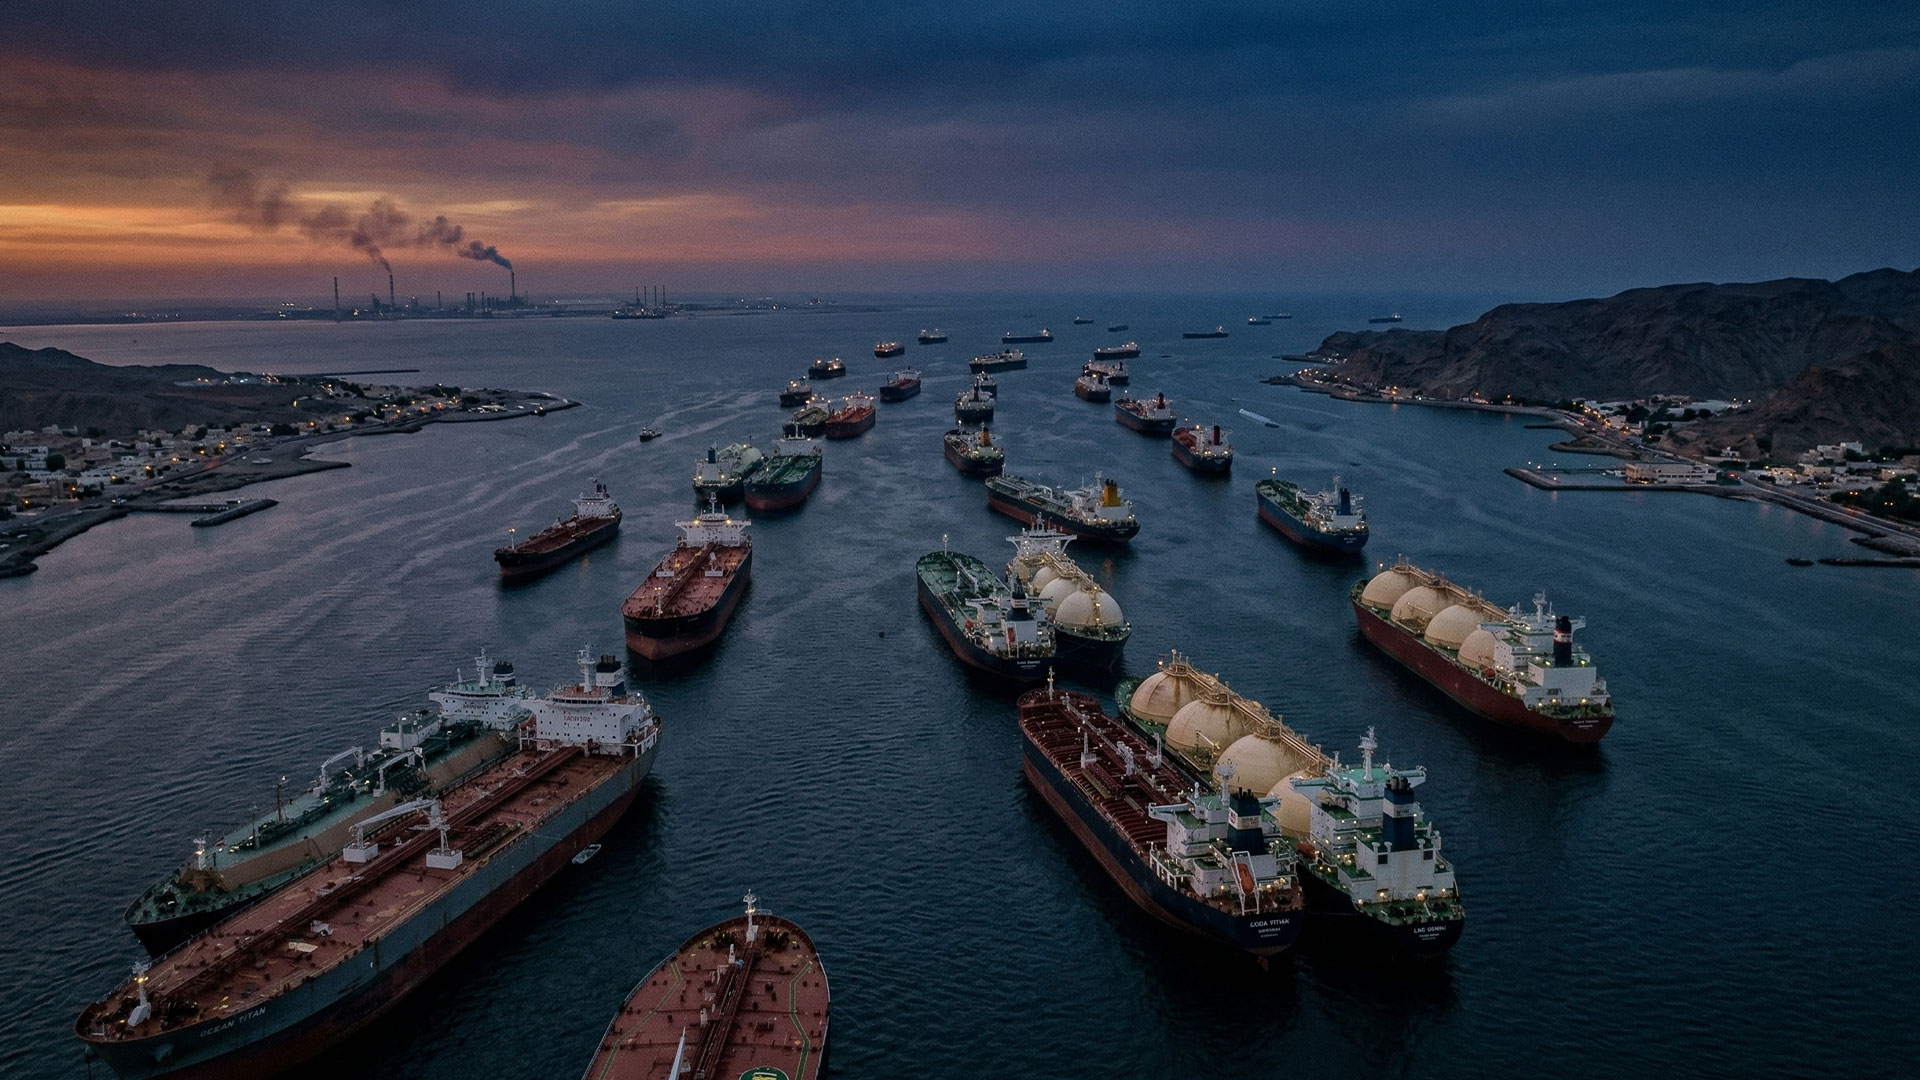
The near-total closure of the Strait of Hormuz and the strike on Qatar’s Ras Laffan LNG complex represent a generational disruption to global energy supply chains. The IEA has called it the largest oil supply disruption in the agency’s history. WTI crude has traded in a wide $80–$117 range over the past month and currently sits near $97 per barrel, with weekly swings of 10% or more becoming routine.
The instinct for most investors is to react to the headlines. Ours is to look at the physical reality beneath them, and to ask what it means for the assets already in the ground.
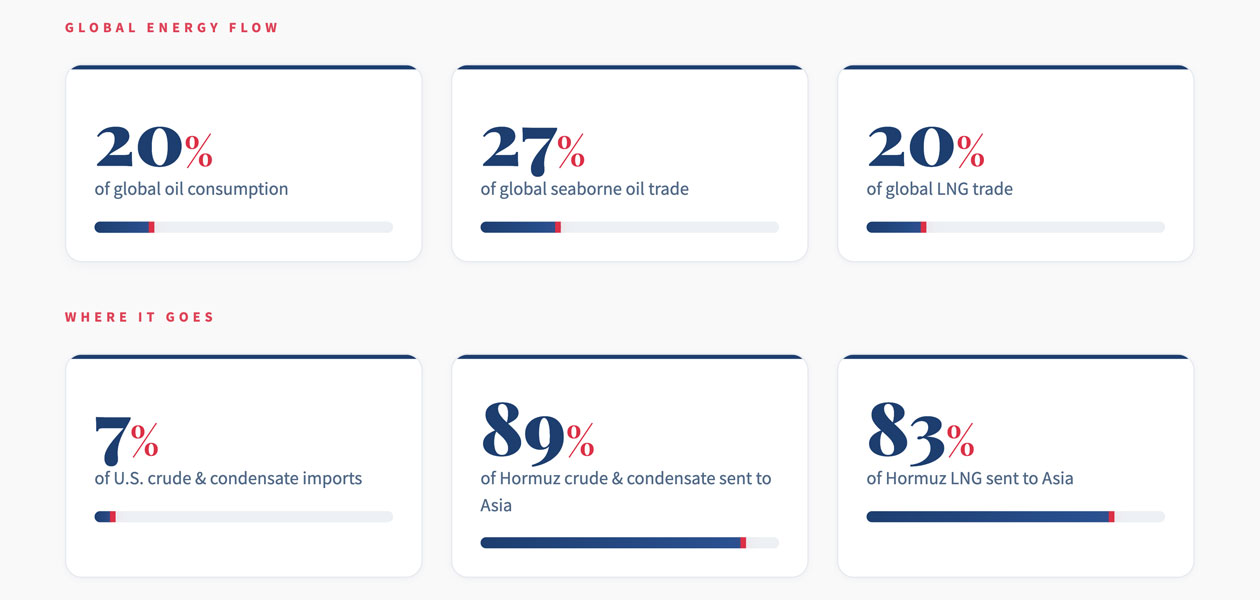
The Strait of Hormuz is the world’s most critical energy chokepoint. Roughly 20% of global oil consumption and 27% of seaborne oil trade transits this narrow waterway daily, along with 20% of the world’s LNG trade. An average of 100 cargo-carrying vessels cross the Strait each day, with 60–70% of them oil tankers and gas carriers.
The exposure, however, is not evenly distributed. Asia absorbs the overwhelming majority of Hormuz-origin energy. 89% of crude and condensate and 83% of LNG transiting the Strait flows to Asian buyers, with China alone receiving 37.7% of Hormuz crude oil and condensate. The United States depends on Hormuz for just 7% of its crude and condensate imports.
That 7% figure is the one that matters most for domestic energy investors. The United States is structurally insulated from the worst direct supply consequences of a Hormuz disruption, but fully exposed to the price effects. U.S. producers are selling into a global market where supply has been abruptly constrained, while their production operations remain entirely unaffected.
Domestic working interests aren't just a tax play. They are a structural hedge against the single largest supply-chain risk in global energy.

The strike on Qatar’s Ras Laffan LNG complex in March 2026 adds a second, arguably more consequential layer to this disruption. QatarEnergy declared force majeure on Trains 4 and 6, totaling 12.8 million tonnes per annum, or approximately 17% of Qatari export capacity, and CEO Saad Al-Kaabi has said full restoration will take three to five years, constrained by global lead times for replacement gas turbines. Wood Mackenzie estimates the broader Ras Laffan complex will not return to full operation before late August at the earliest. In 2025, Qatar exported nearly 20% of global LNG supplies through the Strait of Hormuz.
The world's largest LNG export hub is partially offline, and the timeline for restoration is measured in years, not months.
The default replacement source is U.S. Gulf Coast LNG, which draws heavily on Haynesville gas. The EIA estimates U.S. LNG exports were 17.9 Bcf/d in March 2026, an 8% increase over prior forecasts and the second-highest monthly volume on record. The spread between Henry Hub and the Japan-Korea Marker surged 98% to $15.23/MMBtu, while the Henry Hub–TTF spread averaged $14.89/MMBtu.The world’s largest LNG export hub is partially offline, and the timeline for restoration is measured in years, not months.
Basin Ventures holds Haynesville exposure across Fund I, Fund II, and Fund III. Our BPX-operated Haynesville wells realized $6.48/MCF in Q1, well above our modeled base case. This is a structural repricing of the U.S. gas export value chain, not a seasonal blip.
What makes this moment particularly significant is that the Hormuz disruption did not create a tight market. It intensified one that was already forming beneath the surface.
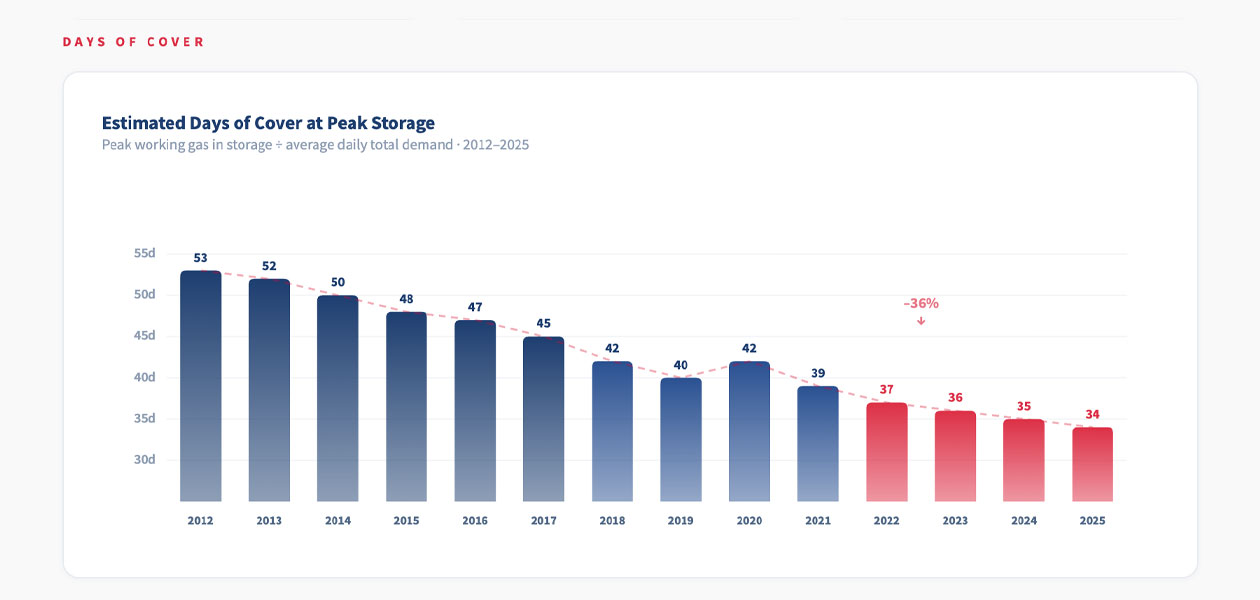
Total demand for U.S. natural gas, including domestic consumption and exports, has grown more than 50% since 2012. Over the same period, working storage capacity has increased only approximately 7%. The result is a steady compression in days of cover, a measure of how many days working gas in storage can satisfy total demand without additional production. That figure has declined from roughly 53 days in 2012 to an estimated 34 days today.
Two structural forces are driving the compression. First, LNG exports have grown from approximately 1 Bcf/d in 2012 to a record 15.1 Bcf/d in 2025, with additional capacity coming online through 2027, including Corpus Christi Stage 3 and Golden Pass Train 1. Second, AI-driven data center demand is adding billions of cubic feet of incremental domestic gas consumption annually, a trend that is accelerating alongside the buildout of hyperscale computing infrastructure.
The storage-to-demand ratio was already signaling structurally tighter markets before a single ship was rerouted from the Persian Gulf. The disruption has simply made the tightness acute.
U.S. natural gas marketed production has increased 27% since January 2019, adding 25 Bcf/d to reach a record 118.5 Bcf/d in 2025. Three states alone (Texas, New Mexico, and West Virginia) have accounted for 94% of that net growth. Henry Hub spot prices rose 60% in 2025 to $3.52/MMBtu, incentivizing growth across all major producing regions.

And yet, despite WTI trading above $90, U.S. producers are not adding rigs in any meaningful way. According to Baker Hughes, oil rigs are down roughly 13% year-over-year (473 to 410), and gas rigs sit at 125, modestly above year-ago levels but still well off prior cycle peaks. Total rigs are down 7% year-over-year. The price spike has been too sudden and too volatile to justify mobilizing new oil drilling programs, and the modest gas response reflects 2025 pricing strength rather than a reaction to the March disruption.
Part of the explanation is consolidation. In recent years, majors like Exxon and Chevron acquired many of the independents who historically chased quick profits during price spikes. The remaining large operators are focused on long-term capital discipline. They are returning cash to shareholders, not scrambling to add footage in a market where crude can swing 10% in a single week.
For investors already positioned in producing assets, that is the advantage. You are in before the chaos, not trying to enter during it.
This restraint is precisely what makes the supply setup so compelling for patient capital. Fewer rigs mean less shock-absorber capacity if additional disruptions occur. And the assets already producing are selling into the highest-priced domestic market in years.
Every producing well in Basin's portfolio is currently realizing above our $70 oil / $3 gas base case.
Our portfolio is strategically balanced between oil and a high-growth gas base positioned to serve the unprecedented convergence of LNG export demand and AI-driven domestic power consumption. The oil-weighted positions provide a durable floor and asymmetric upside in the event of continued supply disruptions. The gas-weighted positions, particularly Haynesville, are directly exposed to the structural repricing now underway.
The Strait of Hormuz disruption and the Ras Laffan strike did not create the investment thesis for domestic energy. They validated it.
Global supply chains are more fragile than reserve estimates suggest. The concentration of critical energy flows through a single narrow waterway, and through a single export facility, has now been stress-tested in real time. The U.S. has emerged as the world's primary swing supplier, with exports rising and refineries operating near full capacity.
At Basin Ventures, we built our platform for this environment. A non-operated working interest model that avoids operational overhead. Partnerships with top-tier operators who are executing under budget and ahead of schedule. Exposure to the basins (Haynesville, Anadarko, Eagle Ford) where structural demand is most concentrated.
We are not in the business of predicting where oil trades next month. We are positioned in producing assets that benefit from where it trades today, with the development runway to participate in the long-term demand curve that LNG exports, AI power consumption, and tightening storage balances are building beneath the surface.
For accredited investors evaluating where to deploy capital, the case for domestic energy has rarely been more straightforward: proven reserves, disciplined operators, favorable tax treatment, and a global supply picture that continues to reward those who are already in the ground.


We have written often about the tailwinds building behind U.S. natural gas: rising LNG export capacity, AI-driven power demand, and a storage-to-demand balance that has been tightening for over a decade. The events of March and April 2026 have accelerated every one of those trends simultaneously.
The near-total closure of the Strait of Hormuz and the strike on Qatar’s Ras Laffan LNG complex represent a generational disruption to global energy supply chains. The IEA has called it the largest oil supply disruption in the agency’s history. WTI crude has traded in a wide $80–$117 range over the past month and currently sits near $97 per barrel, with weekly swings of 10% or more becoming routine.
The instinct for most investors is to react to the headlines. Ours is to look at the physical reality beneath them, and to ask what it means for the assets already in the ground.
The Strait of Hormuz is the world’s most critical energy chokepoint. Roughly 20% of global oil consumption and 27% of seaborne oil trade transits this narrow waterway daily, along with 20% of the world’s LNG trade. An average of 100 cargo-carrying vessels cross the Strait each day, with 60–70% of them oil tankers and gas carriers.
The exposure, however, is not evenly distributed. Asia absorbs the overwhelming majority of Hormuz-origin energy. 89% of crude and condensate and 83% of LNG transiting the Strait flows to Asian buyers, with China alone receiving 37.7% of Hormuz crude oil and condensate. The United States depends on Hormuz for just 7% of its crude and condensate imports.
That 7% figure is the one that matters most for domestic energy investors. The United States is structurally insulated from the worst direct supply consequences of a Hormuz disruption, but fully exposed to the price effects. U.S. producers are selling into a global market where supply has been abruptly constrained, while their production operations remain entirely unaffected.
Domestic working interests aren't just a tax play. They are a structural hedge against the single largest supply-chain risk in global energy.

The strike on Qatar’s Ras Laffan LNG complex in March 2026 adds a second, arguably more consequential layer to this disruption. QatarEnergy declared force majeure on Trains 4 and 6, totaling 12.8 million tonnes per annum, or approximately 17% of Qatari export capacity, and CEO Saad Al-Kaabi has said full restoration will take three to five years, constrained by global lead times for replacement gas turbines. Wood Mackenzie estimates the broader Ras Laffan complex will not return to full operation before late August at the earliest. In 2025, Qatar exported nearly 20% of global LNG supplies through the Strait of Hormuz.
The world's largest LNG export hub is partially offline, and the timeline for restoration is measured in years, not months.
The default replacement source is U.S. Gulf Coast LNG, which draws heavily on Haynesville gas. The EIA estimates U.S. LNG exports were 17.9 Bcf/d in March 2026, an 8% increase over prior forecasts and the second-highest monthly volume on record. The spread between Henry Hub and the Japan-Korea Marker surged 98% to $15.23/MMBtu, while the Henry Hub–TTF spread averaged $14.89/MMBtu.The world’s largest LNG export hub is partially offline, and the timeline for restoration is measured in years, not months.
Basin Ventures holds Haynesville exposure across Fund I, Fund II, and Fund III. Our BPX-operated Haynesville wells realized $6.48/MCF in Q1, well above our modeled base case. This is a structural repricing of the U.S. gas export value chain, not a seasonal blip.
What makes this moment particularly significant is that the Hormuz disruption did not create a tight market. It intensified one that was already forming beneath the surface.
Total demand for U.S. natural gas, including domestic consumption and exports, has grown more than 50% since 2012. Over the same period, working storage capacity has increased only approximately 7%. The result is a steady compression in days of cover, a measure of how many days working gas in storage can satisfy total demand without additional production. That figure has declined from roughly 53 days in 2012 to an estimated 34 days today.
Two structural forces are driving the compression. First, LNG exports have grown from approximately 1 Bcf/d in 2012 to a record 15.1 Bcf/d in 2025, with additional capacity coming online through 2027, including Corpus Christi Stage 3 and Golden Pass Train 1. Second, AI-driven data center demand is adding billions of cubic feet of incremental domestic gas consumption annually, a trend that is accelerating alongside the buildout of hyperscale computing infrastructure.
The storage-to-demand ratio was already signaling structurally tighter markets before a single ship was rerouted from the Persian Gulf. The disruption has simply made the tightness acute.

U.S. natural gas marketed production has increased 27% since January 2019, adding 25 Bcf/d to reach a record 118.5 Bcf/d in 2025. Three states alone (Texas, New Mexico, and West Virginia) have accounted for 94% of that net growth. Henry Hub spot prices rose 60% in 2025 to $3.52/MMBtu, incentivizing growth across all major producing regions.
And yet, despite WTI trading above $90, U.S. producers are not adding rigs in any meaningful way. According to Baker Hughes, oil rigs are down roughly 13% year-over-year (473 to 410), and gas rigs sit at 125, modestly above year-ago levels but still well off prior cycle peaks. Total rigs are down 7% year-over-year. The price spike has been too sudden and too volatile to justify mobilizing new oil drilling programs, and the modest gas response reflects 2025 pricing strength rather than a reaction to the March disruption.
Part of the explanation is consolidation. In recent years, majors like Exxon and Chevron acquired many of the independents who historically chased quick profits during price spikes. The remaining large operators are focused on long-term capital discipline. They are returning cash to shareholders, not scrambling to add footage in a market where crude can swing 10% in a single week.
For investors already positioned in producing assets, that is the advantage. You are in before the chaos, not trying to enter during it.
This restraint is precisely what makes the supply setup so compelling for patient capital. Fewer rigs mean less shock-absorber capacity if additional disruptions occur. And the assets already producing are selling into the highest-priced domestic market in years.
Every producing well in Basin's portfolio is currently realizing above our $70 oil / $3 gas base case.
Our portfolio is strategically balanced between oil and a high-growth gas base positioned to serve the unprecedented convergence of LNG export demand and AI-driven domestic power consumption. The oil-weighted positions provide a durable floor and asymmetric upside in the event of continued supply disruptions. The gas-weighted positions, particularly Haynesville, are directly exposed to the structural repricing now underway.
The Strait of Hormuz disruption and the Ras Laffan strike did not create the investment thesis for domestic energy. They validated it.
Global supply chains are more fragile than reserve estimates suggest. The concentration of critical energy flows through a single narrow waterway, and through a single export facility, has now been stress-tested in real time. The U.S. has emerged as the world's primary swing supplier, with exports rising and refineries operating near full capacity.
At Basin Ventures, we built our platform for this environment. A non-operated working interest model that avoids operational overhead. Partnerships with top-tier operators who are executing under budget and ahead of schedule. Exposure to the basins (Haynesville, Anadarko, Eagle Ford) where structural demand is most concentrated.
We are not in the business of predicting where oil trades next month. We are positioned in producing assets that benefit from where it trades today, with the development runway to participate in the long-term demand curve that LNG exports, AI power consumption, and tightening storage balances are building beneath the surface.
For accredited investors evaluating where to deploy capital, the case for domestic energy has rarely been more straightforward: proven reserves, disciplined operators, favorable tax treatment, and a global supply picture that continues to reward those who are already in the ground.

© Copyright 2026 Basin Ventures II, LLC. All right reserved.