Watch Replay: Basin Ventures Q1 Investor Webinar
Watch Now
Website Cookies
This website uses cookies to ensure you get the best experience on our site.


In April we wrote that the Strait of Hormuz disruption did not create the case for domestic energy. It validated it. Eight weeks later, the war appears to be ending. On Sunday evening, President Trump announced that a deal with Iran was complete, authorizing the reopening of the Strait of Hormuz and the removal of the U.S. naval blockade. By the time American markets opened Monday morning, WTI crude had fallen to roughly $80.53 per barrel, down more than 5%, its lowest level since March. Brent sat near $83.
The instinct across the market was immediate relief. The premium that built up over more than three months of conflict began to come out of the price in a matter of hours. Our instinct, as always, is to look at the physical reality beneath the headline and ask a simpler question: what actually changed this weekend?
The answer is almost nothing. A signature reopens a shipping lane. It does not refill a drained reserve, restore the barrels the world burned through during the disruption, or rebuild damaged infrastructure. The price moved. The barrels did not. For investors positioned in producing assets, the gap between those two facts is the entire point.
For weeks we have made a two-part argument. First, that the supply and demand fundamentals, once the war premium is stripped out, support crude in the high $80s, roughly $88 to $92. Second, and more important, that the trading price has almost no relationship to those fundamentals in the short run. Markets trade headlines. The barrels move on a different clock.
That second point is not an opinion. It is measurable, and we measured it. Using weekly EIA data running back to 1990, we tested the relationship between the U.S. physical supply position and the real (inflation-adjusted) price of crude. The correlation between the combined inventory cushion and price is statistically near zero. The correlation between the supply-demand balance and price is near zero. The correlation between the pace of inventory drawdown and the price change that follows is near zero. Across 35 years and more than 1,800 weekly observations, the physical setup and the screen price simply do not move together on any horizon a trader cares about.
This morning is the cleanest illustration imaginable. Consider the round trip the price has taken this year.
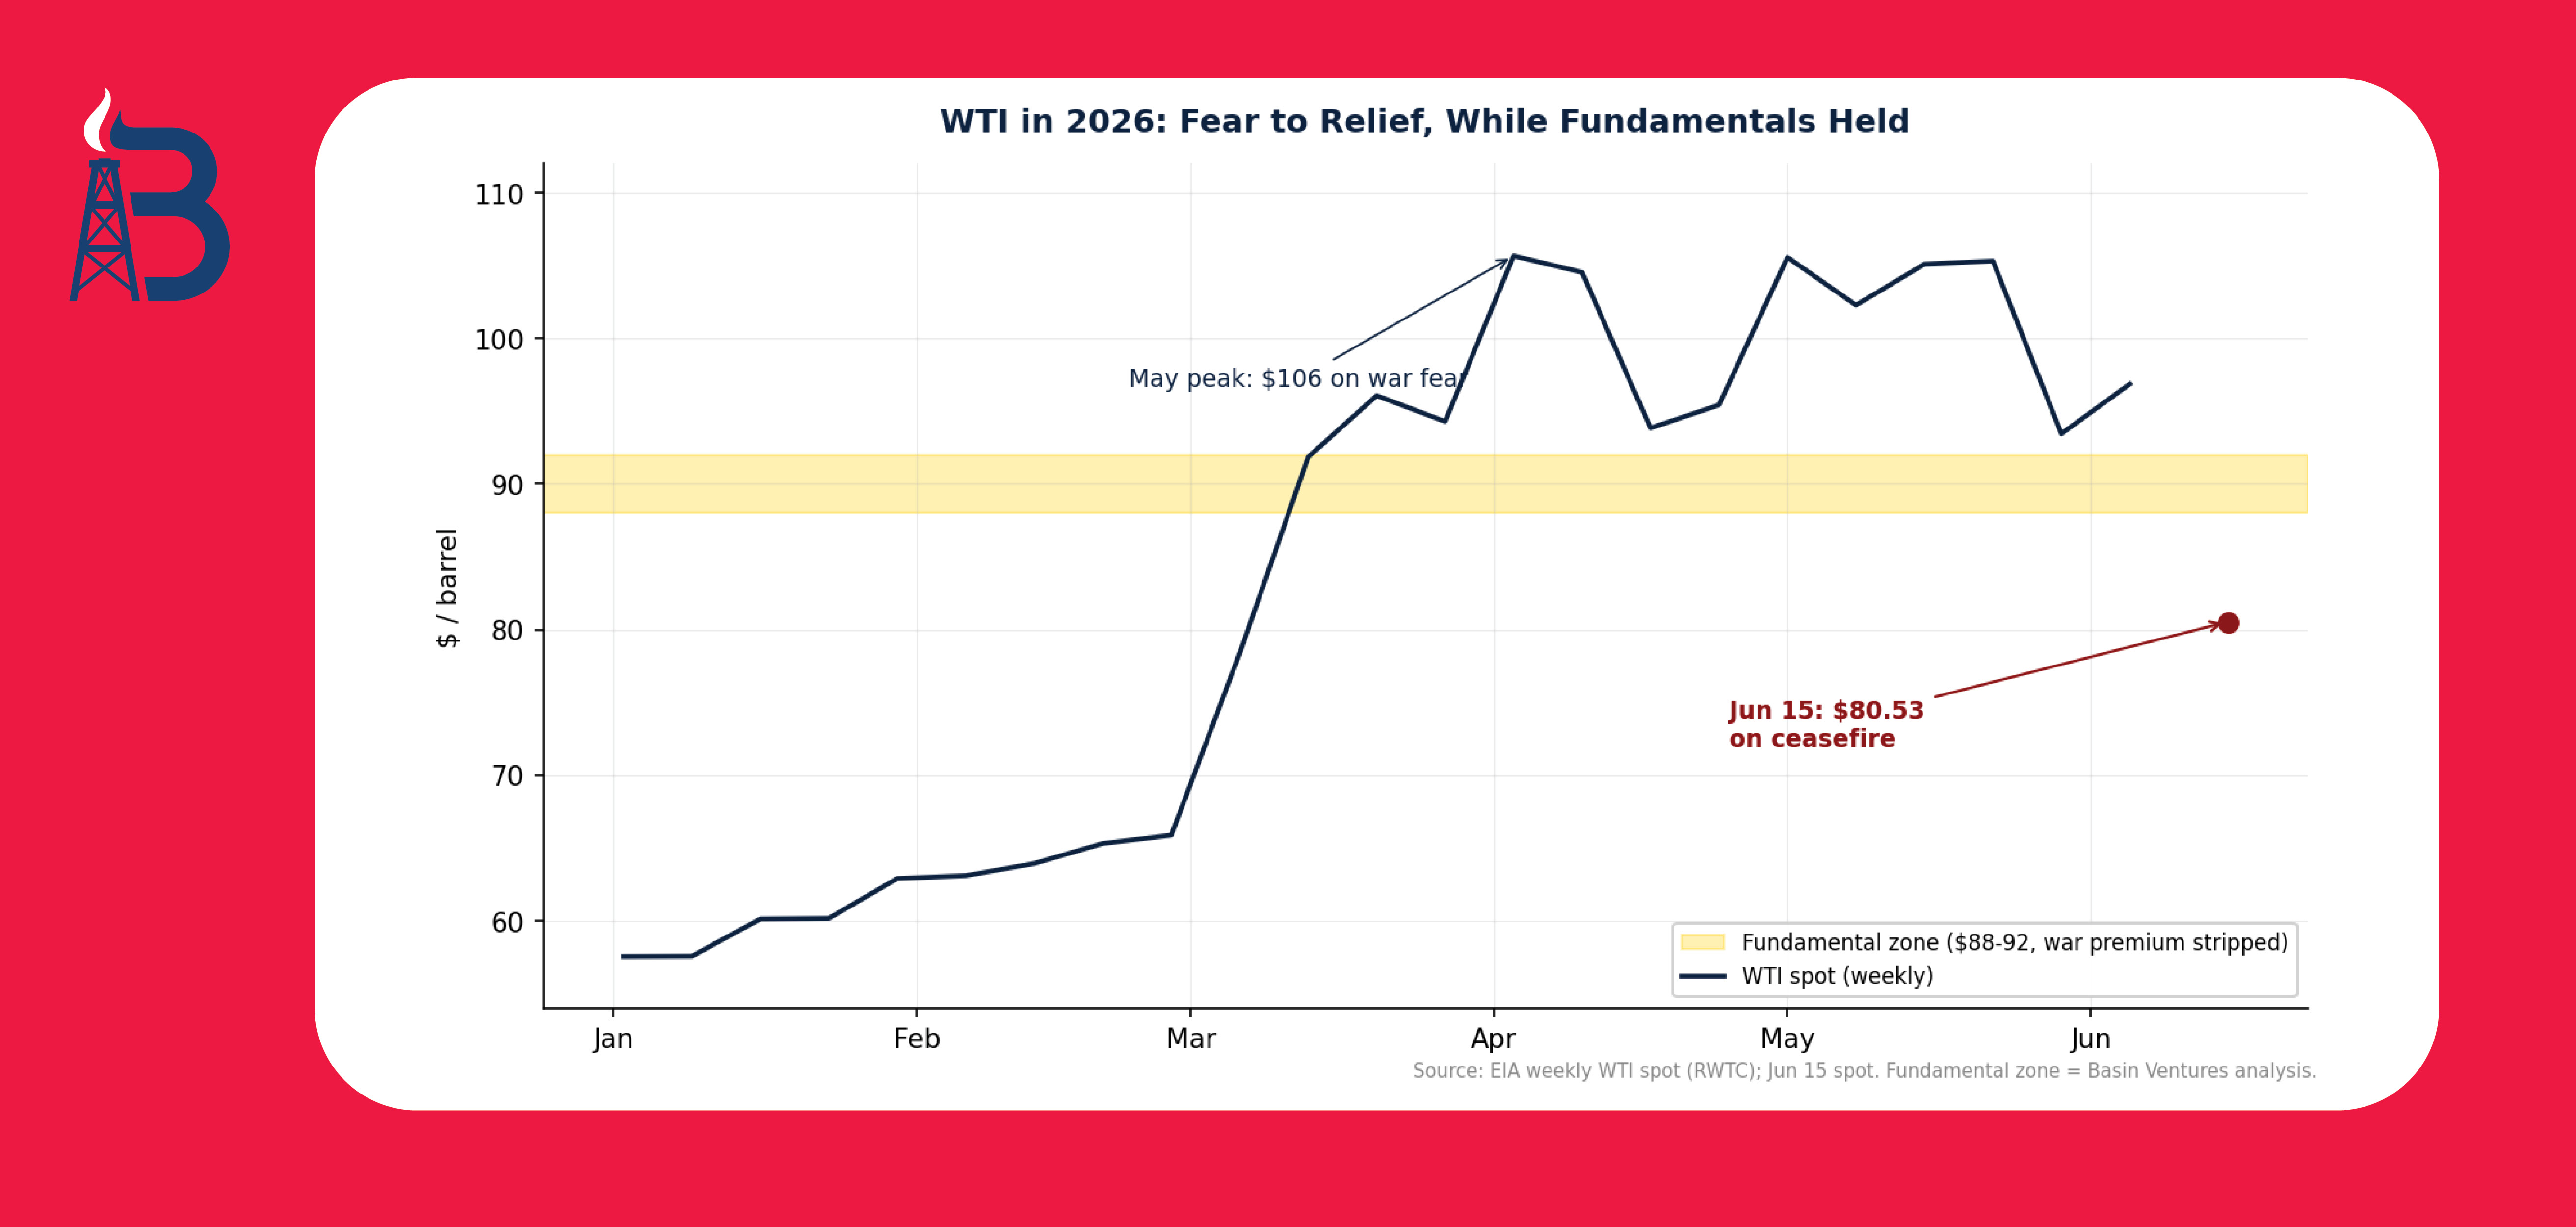
In January, WTI sat near $58. As the conflict escalated and Hormuz effectively closed, fear took it above $105 by May. This weekend, relief took it back to $80 in a matter of days. Through that entire $50 swing, the underlying physical balance, the drawn-down cushion, the record export pace, the damaged global infrastructure, barely moved. Price flew past the fundamental zone to the upside on fear, and is now flying past it to the downside on relief. We never predicted a price. We described a disconnect. The market has now demonstrated it twice in three weeks.
We are not in the business of predicting where oil trades next month. We are in the business of understanding the difference between what a barrel is worth and what it happens to trade for today.
There is an important caveat to the near-zero correlation, and it is where the analysis gets genuinely useful. Inventories and price do move together in one specific circumstance: when the market believes there is no slack to refill the gap. The demand-pull episodes of 2008 and the 2021-2022 recovery are the textbook cases. In both, tight inventories and high prices ran together precisely because the market saw no buffer waiting in reserve.
When the market believes a buffer exists, tightness gets ignored. And for the last decade, that buffer had a name: U.S. shale. The shale patch became the world's swing producer, the source everyone assumed would ramp up and refill any shortfall. That belief is the single biggest reason tight inventories coexisted with moderate prices through the late 2010s and into the 2020s. The market never panicked over thin storage because it trusted American production to save the day.
That assumption is now cracking.
For the first time in the shale era, U.S. crude oil production is projected to decline year over year rather than grow. The EIA's latest Short-Term Energy Outlook forecasts U.S. crude production averaging about 13.5 million barrels per day in 2026, roughly 100,000 b/d below 2025, ending four consecutive years of growth. Rig counts have fallen to levels not seen since 2021, with U.S. oil rigs in the low 440s. The Permian, the engine of all recent growth, is plateauing on a combination of capital discipline and dwindling tier-one acreage. Operators themselves, including names like Diamondback, have publicly stated that output has effectively peaked.
Whether this is “can't” or “won't” is a fair debate. There is drilled-but-uncompleted inventory sitting in reserve, which argues that producers could respond to higher prices if they chose to. The consolidation of the independents into majors focused on shareholder returns rather than growth argues the same. But the conclusion lands in the same place regardless of motive: the buffer the market has leaned on for a decade is no longer reliably growing, and the people who run it are not behaving as though they believe in sustained higher prices.
This is the structural shift that should concern anyone reading the $80 print as a return to normal. The assumption underwriting the market's complacency, that shale will always be there to refill the gap, is weakening at exactly the moment the cushion has never been thinner.
When the Gulf went offline and Hormuz closed, the world came to the United States for barrels. U.S. crude and petroleum product exports rose to an all-time record of roughly 12.7 million barrels per day. We became the world's supplier of last resort, and we drew down our own inventories to do it. EIA data confirmed inventories of crude, gasoline, and diesel falling even as exports hit record highs.
The result is visible in the single most important chart we track.
U.S. combined oil cushion (commercial + SPR) measured in days of demand cover, 1990-2026. Source: EIA weekly series; Basin Ventures analysis.
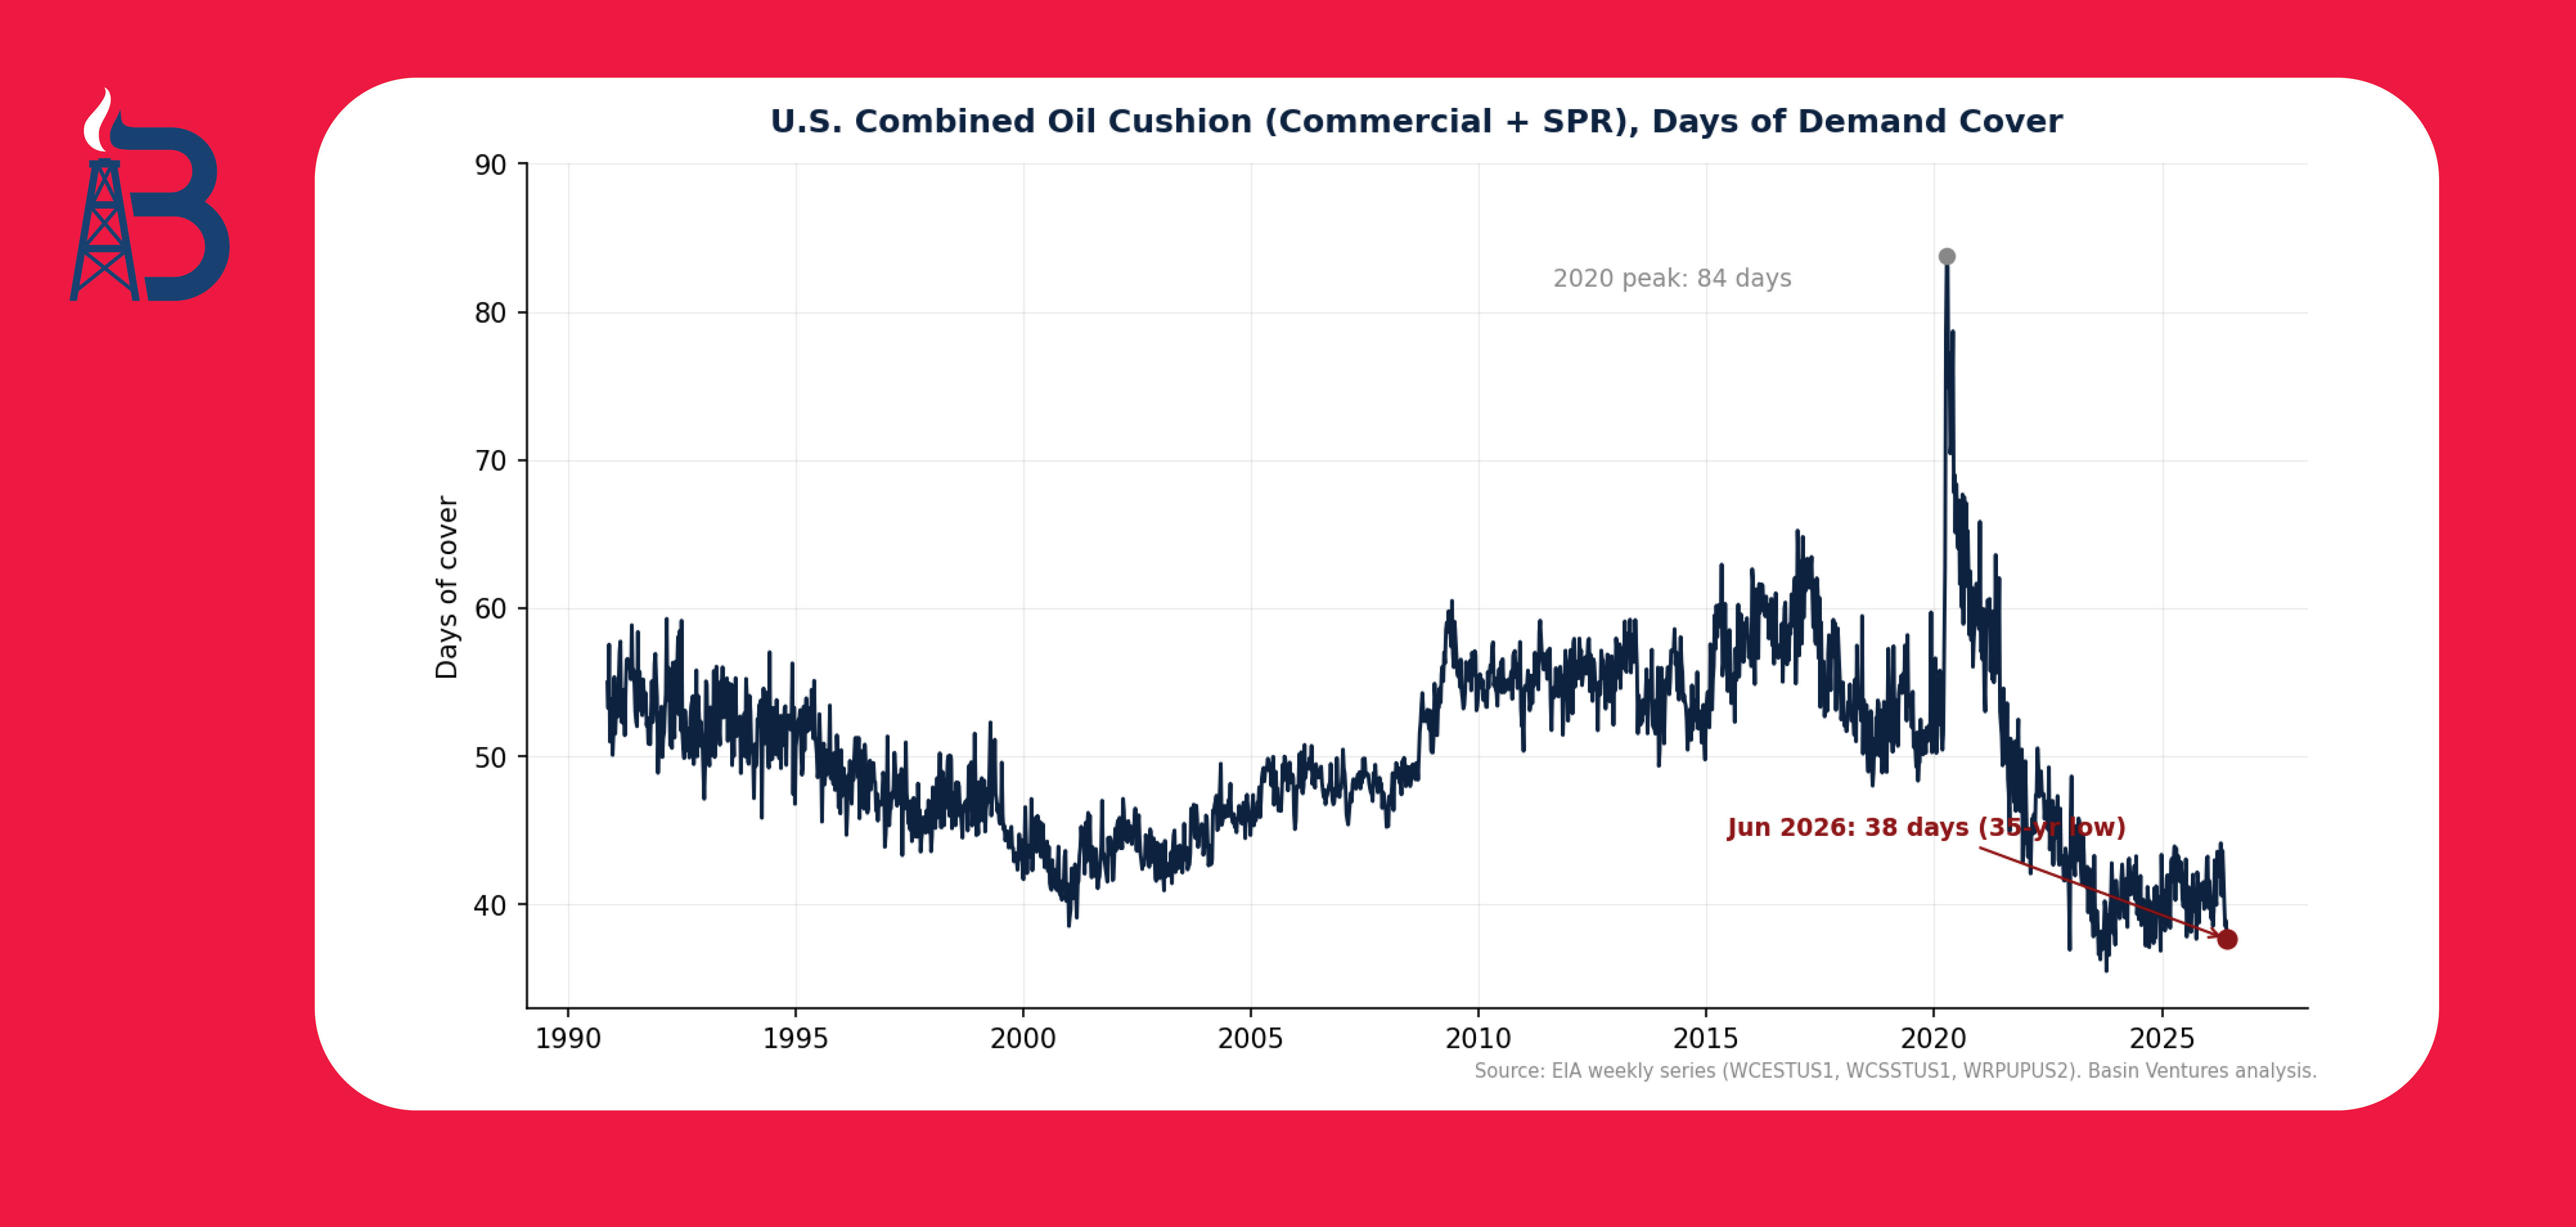
The combined U.S. oil cushion, commercial crude inventories plus the Strategic Petroleum Reserve, measured against daily demand, has fallen to roughly 38 days of cover. That is the lowest level in the 35 years of weekly data, down about 55% from the April 2020 peak of roughly 84 days. The strategic half of that cushion, the SPR, sits near 349 million barrels, a level last seen in the early 1980s, and was drawn down by roughly 66 million barrels in the 13 weeks leading into the deal. Refilling it is slow and expensive, and the obligation to refill it represents real future demand regardless of what happens at Hormuz.
The terms of the announced deal reinforce, rather than relieve, this picture. Reporting indicates roughly $25 billion in frozen Iranian assets to be released, the nuclear enforcement question deferred to later negotiations with a regime the U.S. has long described as untrustworthy, and the Strait reopening on arrangements coordinated with Tehran while the U.S. naval blockade is withdrawn. Iran retains the physical ability to disrupt the chokepoint again; the leverage that forced the issue is sailing home.
More to the point for physical supply: even a fully executed deal does not restore the market overnight. The infrastructure damaged during the war, including the strike on Qatar's Ras Laffan complex we wrote about in April, carries restoration timelines measured in months to years, with some facilities far longer. A reopened shipping lane is a real and meaningful supply event over the coming months. It is not the instantaneous return to normal that a 5% single-day price drop implies.
The geopolitical risk to the world's most important energy chokepoint did not disappear this weekend. It was repriced to roughly zero by a market that wanted to believe it had.
We built our platform for exactly this kind of environment, where the screen price and the physical reality diverge and patient capital is positioned in producing assets rather than chasing entries during the chaos.
Basin Ventures maintains a portfolio strategically balanced between oil-weighted positions and a high-growth gas base. The oil-weighted positions provide a durable floor and asymmetric upside in the event of further disruption, of which a thin national cushion and a plateauing shale base make the system more, not less, vulnerable. The gas-weighted positions, particularly in the Haynesville, remain exposed to the structural LNG and power-demand repricing we have written about previously. Our partner operators continue to execute against our conservative $70 oil / $3 gas underwriting base case, a figure grounded in the 20-year blended historical average rather than in any single year's price.
The distinction we would leave investors with is between three things that are easily confused: value, timing, and risk. Fundamentals tell you what a barrel is worth. The near-zero correlation tells you they will not tell you what it trades for next week. And the spent cushion, paired with a shale base that is topping out, tells you the margin for absorbing the next disruption is the thinnest it has been in decades. An $80 print can hold for weeks on sentiment. It does not rebuild the shock absorber the country just spent.
The market spent the weekend celebrating the end of a war. That celebration is understandable, and the de-escalation is genuinely good news. But a signature in Europe did not put a single barrel back into American storage, did not restart the production the world drew down, and did not rebuild the reserve capacity that has quietly fallen to a 35-year low.
We do not predict where oil trades next month. No one credibly can, and 35 years of data is the proof: price chases the headline of the moment far more than it tracks the barrels in the ground. What we can say with confidence is structural. The United States emerged from this disruption as the world's swing supplier, drew its own cushion to a generational low doing it, and now faces a market pricing a return to normal at the precise moment its domestic production engine is plateauing for the first time in the shale era.
For accredited investors evaluating where to deploy capital, the case has not changed because the headline did. Proven reserves, disciplined operators, favorable tax treatment, and producing assets that benefit from where oil trades today, with the development runway to participate in a long-term demand picture that the data, not the day's sentiment, continues to build beneath the surface.
U.S. Energy Information Administration (EIA), Weekly Petroleum Status Report, commercial crude, SPR, products supplied, production, and WTI spot series (WCESTUS1, WCSSTUS1, WRPUPUS2, WCRFPUS2, RWTC), 1990 through June 5, 2026
This commentary is for informational and educational purposes only and does not constitute an offer to sell or a solicitation of an offer to buy any security. Investments in oil and gas involve substantial risk and are suitable only for accredited investors. Past performance and current market conditions are not indicative of future results.


In April we wrote that the Strait of Hormuz disruption did not create the case for domestic energy. It validated it. Eight weeks later, the war appears to be ending. On Sunday evening, President Trump announced that a deal with Iran was complete, authorizing the reopening of the Strait of Hormuz and the removal of the U.S. naval blockade. By the time American markets opened Monday morning, WTI crude had fallen to roughly $80.53 per barrel, down more than 5%, its lowest level since March. Brent sat near $83.
The instinct across the market was immediate relief. The premium that built up over more than three months of conflict began to come out of the price in a matter of hours. Our instinct, as always, is to look at the physical reality beneath the headline and ask a simpler question: what actually changed this weekend?
The answer is almost nothing. A signature reopens a shipping lane. It does not refill a drained reserve, restore the barrels the world burned through during the disruption, or rebuild damaged infrastructure. The price moved. The barrels did not. For investors positioned in producing assets, the gap between those two facts is the entire point.
For weeks we have made a two-part argument. First, that the supply and demand fundamentals, once the war premium is stripped out, support crude in the high $80s, roughly $88 to $92. Second, and more important, that the trading price has almost no relationship to those fundamentals in the short run. Markets trade headlines. The barrels move on a different clock.
That second point is not an opinion. It is measurable, and we measured it. Using weekly EIA data running back to 1990, we tested the relationship between the U.S. physical supply position and the real (inflation-adjusted) price of crude. The correlation between the combined inventory cushion and price is statistically near zero. The correlation between the supply-demand balance and price is near zero. The correlation between the pace of inventory drawdown and the price change that follows is near zero. Across 35 years and more than 1,800 weekly observations, the physical setup and the screen price simply do not move together on any horizon a trader cares about.
This morning is the cleanest illustration imaginable. Consider the round trip the price has taken this year.
In January, WTI sat near $58. As the conflict escalated and Hormuz effectively closed, fear took it above $105 by May. This weekend, relief took it back to $80 in a matter of days. Through that entire $50 swing, the underlying physical balance, the drawn-down cushion, the record export pace, the damaged global infrastructure, barely moved. Price flew past the fundamental zone to the upside on fear, and is now flying past it to the downside on relief. We never predicted a price. We described a disconnect. The market has now demonstrated it twice in three weeks.
We are not in the business of predicting where oil trades next month. We are in the business of understanding the difference between what a barrel is worth and what it happens to trade for today.
There is an important caveat to the near-zero correlation, and it is where the analysis gets genuinely useful. Inventories and price do move together in one specific circumstance: when the market believes there is no slack to refill the gap. The demand-pull episodes of 2008 and the 2021-2022 recovery are the textbook cases. In both, tight inventories and high prices ran together precisely because the market saw no buffer waiting in reserve.
When the market believes a buffer exists, tightness gets ignored. And for the last decade, that buffer had a name: U.S. shale. The shale patch became the world's swing producer, the source everyone assumed would ramp up and refill any shortfall. That belief is the single biggest reason tight inventories coexisted with moderate prices through the late 2010s and into the 2020s. The market never panicked over thin storage because it trusted American production to save the day.
That assumption is now cracking.
For the first time in the shale era, U.S. crude oil production is projected to decline year over year rather than grow. The EIA's latest Short-Term Energy Outlook forecasts U.S. crude production averaging about 13.5 million barrels per day in 2026, roughly 100,000 b/d below 2025, ending four consecutive years of growth. Rig counts have fallen to levels not seen since 2021, with U.S. oil rigs in the low 440s. The Permian, the engine of all recent growth, is plateauing on a combination of capital discipline and dwindling tier-one acreage. Operators themselves, including names like Diamondback, have publicly stated that output has effectively peaked.
Whether this is “can't” or “won't” is a fair debate. There is drilled-but-uncompleted inventory sitting in reserve, which argues that producers could respond to higher prices if they chose to. The consolidation of the independents into majors focused on shareholder returns rather than growth argues the same. But the conclusion lands in the same place regardless of motive: the buffer the market has leaned on for a decade is no longer reliably growing, and the people who run it are not behaving as though they believe in sustained higher prices.
This is the structural shift that should concern anyone reading the $80 print as a return to normal. The assumption underwriting the market's complacency, that shale will always be there to refill the gap, is weakening at exactly the moment the cushion has never been thinner.
When the Gulf went offline and Hormuz closed, the world came to the United States for barrels. U.S. crude and petroleum product exports rose to an all-time record of roughly 12.7 million barrels per day. We became the world's supplier of last resort, and we drew down our own inventories to do it. EIA data confirmed inventories of crude, gasoline, and diesel falling even as exports hit record highs.
The result is visible in the single most important chart we track.
U.S. combined oil cushion (commercial + SPR) measured in days of demand cover, 1990-2026. Source: EIA weekly series; Basin Ventures analysis.
The combined U.S. oil cushion, commercial crude inventories plus the Strategic Petroleum Reserve, measured against daily demand, has fallen to roughly 38 days of cover. That is the lowest level in the 35 years of weekly data, down about 55% from the April 2020 peak of roughly 84 days. The strategic half of that cushion, the SPR, sits near 349 million barrels, a level last seen in the early 1980s, and was drawn down by roughly 66 million barrels in the 13 weeks leading into the deal. Refilling it is slow and expensive, and the obligation to refill it represents real future demand regardless of what happens at Hormuz.
The terms of the announced deal reinforce, rather than relieve, this picture. Reporting indicates roughly $25 billion in frozen Iranian assets to be released, the nuclear enforcement question deferred to later negotiations with a regime the U.S. has long described as untrustworthy, and the Strait reopening on arrangements coordinated with Tehran while the U.S. naval blockade is withdrawn. Iran retains the physical ability to disrupt the chokepoint again; the leverage that forced the issue is sailing home.
More to the point for physical supply: even a fully executed deal does not restore the market overnight. The infrastructure damaged during the war, including the strike on Qatar's Ras Laffan complex we wrote about in April, carries restoration timelines measured in months to years, with some facilities far longer. A reopened shipping lane is a real and meaningful supply event over the coming months. It is not the instantaneous return to normal that a 5% single-day price drop implies.
The geopolitical risk to the world's most important energy chokepoint did not disappear this weekend. It was repriced to roughly zero by a market that wanted to believe it had.
We built our platform for exactly this kind of environment, where the screen price and the physical reality diverge and patient capital is positioned in producing assets rather than chasing entries during the chaos.
Basin Ventures maintains a portfolio strategically balanced between oil-weighted positions and a high-growth gas base. The oil-weighted positions provide a durable floor and asymmetric upside in the event of further disruption, of which a thin national cushion and a plateauing shale base make the system more, not less, vulnerable. The gas-weighted positions, particularly in the Haynesville, remain exposed to the structural LNG and power-demand repricing we have written about previously. Our partner operators continue to execute against our conservative $70 oil / $3 gas underwriting base case, a figure grounded in the 20-year blended historical average rather than in any single year's price.
The distinction we would leave investors with is between three things that are easily confused: value, timing, and risk. Fundamentals tell you what a barrel is worth. The near-zero correlation tells you they will not tell you what it trades for next week. And the spent cushion, paired with a shale base that is topping out, tells you the margin for absorbing the next disruption is the thinnest it has been in decades. An $80 print can hold for weeks on sentiment. It does not rebuild the shock absorber the country just spent.
The market spent the weekend celebrating the end of a war. That celebration is understandable, and the de-escalation is genuinely good news. But a signature in Europe did not put a single barrel back into American storage, did not restart the production the world drew down, and did not rebuild the reserve capacity that has quietly fallen to a 35-year low.
We do not predict where oil trades next month. No one credibly can, and 35 years of data is the proof: price chases the headline of the moment far more than it tracks the barrels in the ground. What we can say with confidence is structural. The United States emerged from this disruption as the world's swing supplier, drew its own cushion to a generational low doing it, and now faces a market pricing a return to normal at the precise moment its domestic production engine is plateauing for the first time in the shale era.
For accredited investors evaluating where to deploy capital, the case has not changed because the headline did. Proven reserves, disciplined operators, favorable tax treatment, and producing assets that benefit from where oil trades today, with the development runway to participate in a long-term demand picture that the data, not the day's sentiment, continues to build beneath the surface.
U.S. Energy Information Administration (EIA), Weekly Petroleum Status Report, commercial crude, SPR, products supplied, production, and WTI spot series (WCESTUS1, WCSSTUS1, WRPUPUS2, WCRFPUS2, RWTC), 1990 through June 5, 2026
This commentary is for informational and educational purposes only and does not constitute an offer to sell or a solicitation of an offer to buy any security. Investments in oil and gas involve substantial risk and are suitable only for accredited investors. Past performance and current market conditions are not indicative of future results.

© Copyright 2026 Basin Ventures II, LLC. All right reserved.